
Site selection software
Site selection software, built for Australian networks.
Pick the right site faster. Demographics, demand, traffic and competitor coverage on one map, for retail, food and beverage, fitness, fuel and property networks running 5 to 500 sites.
Self-serve from day one. No GIS engineer required.
Variables across every catchment view
Australian suburbs with full coverage
Named tenants in the supply database
Pricing visible. No GIS engineer required.
What is site selection?
Site selection is the process of identifying and evaluating geographic locations for new commercial sites, retail stores, restaurants, gyms, fuel sites, mixed-use developments. A complete site selection analysis looks at the catchment population, the demographic fit to the brand, competitor density inside the trade area, and how the candidate site compares against the existing network.
Done well, site selection turns a multi-million dollar capex commitment into a defensible, data-led decision. Done poorly, it locks a network into a five-year underperformer. SiteGaps brings the four data layers most site selection teams need, catchment, demographics, supply, and forecast, onto one map.
A complete site selection workflow on one map.
Four data layers, one platform. Toggle each on or off; every metric in the report reconciles to whichever catchment is active.
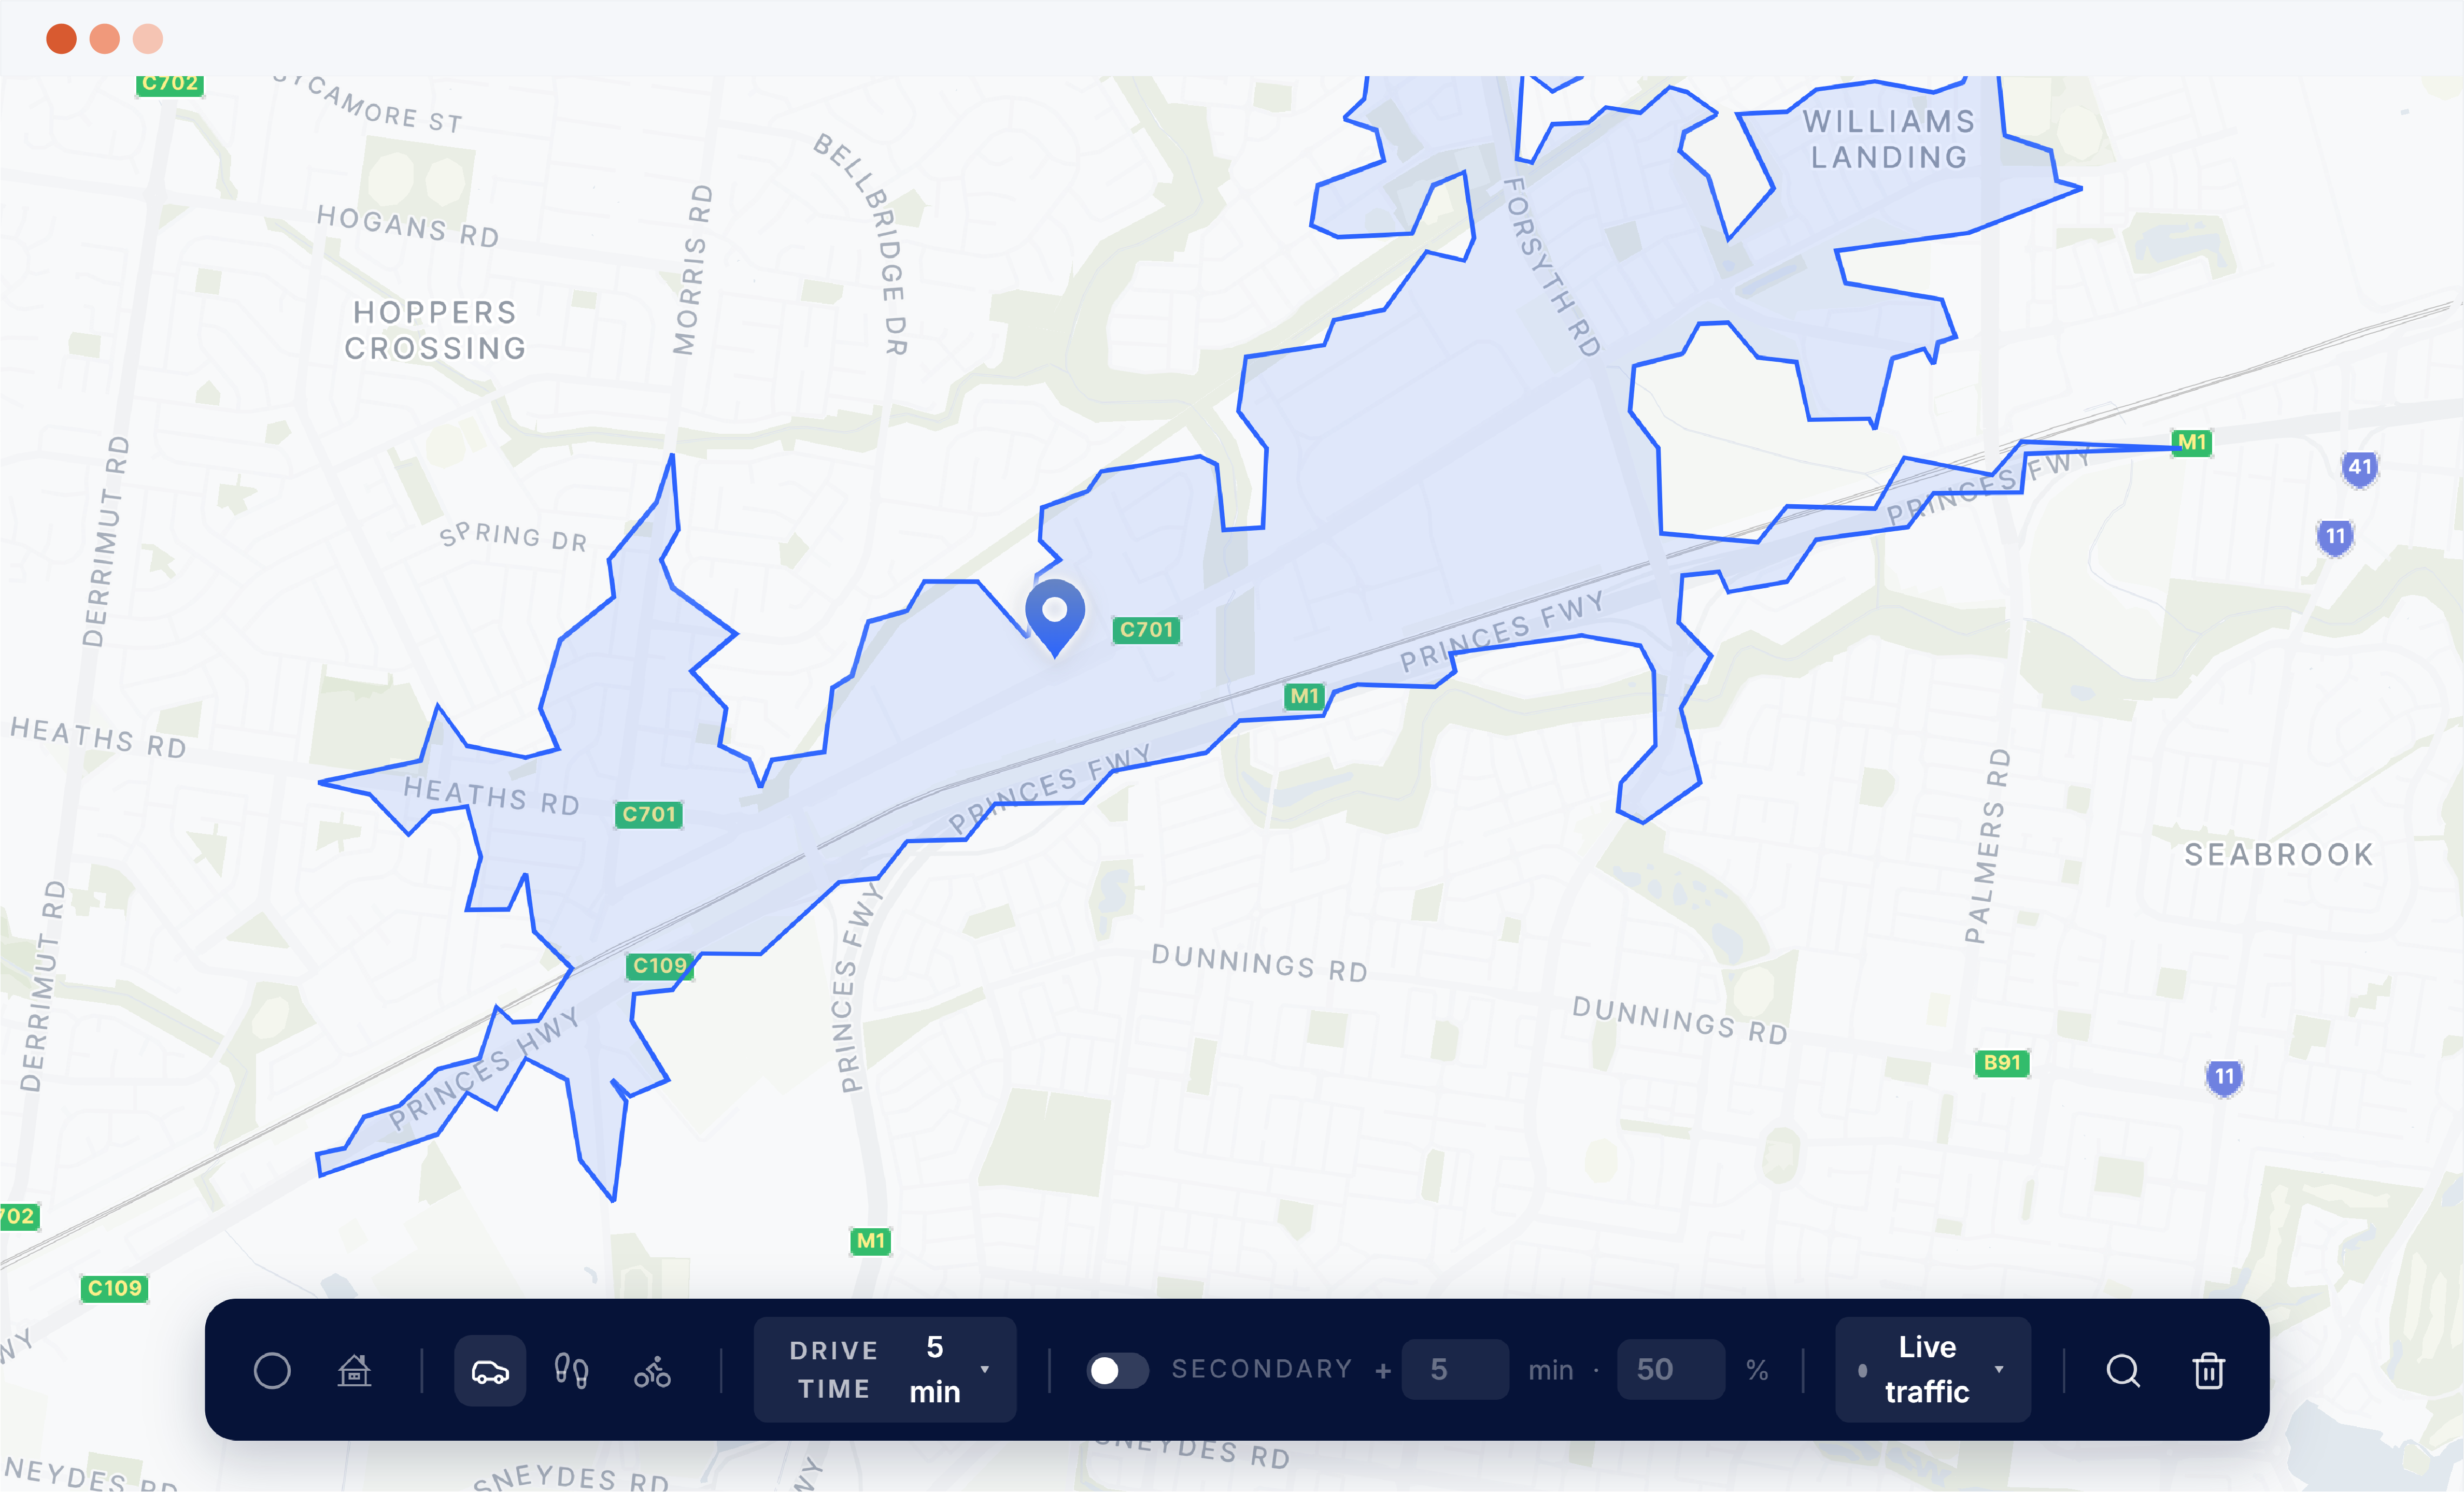
Trade-area catchments
Drive-time isochrones, radius circles, suburb boundaries, or a hand-drawn polygon. Every catchment shape feeds the same demographic and supply pipeline.
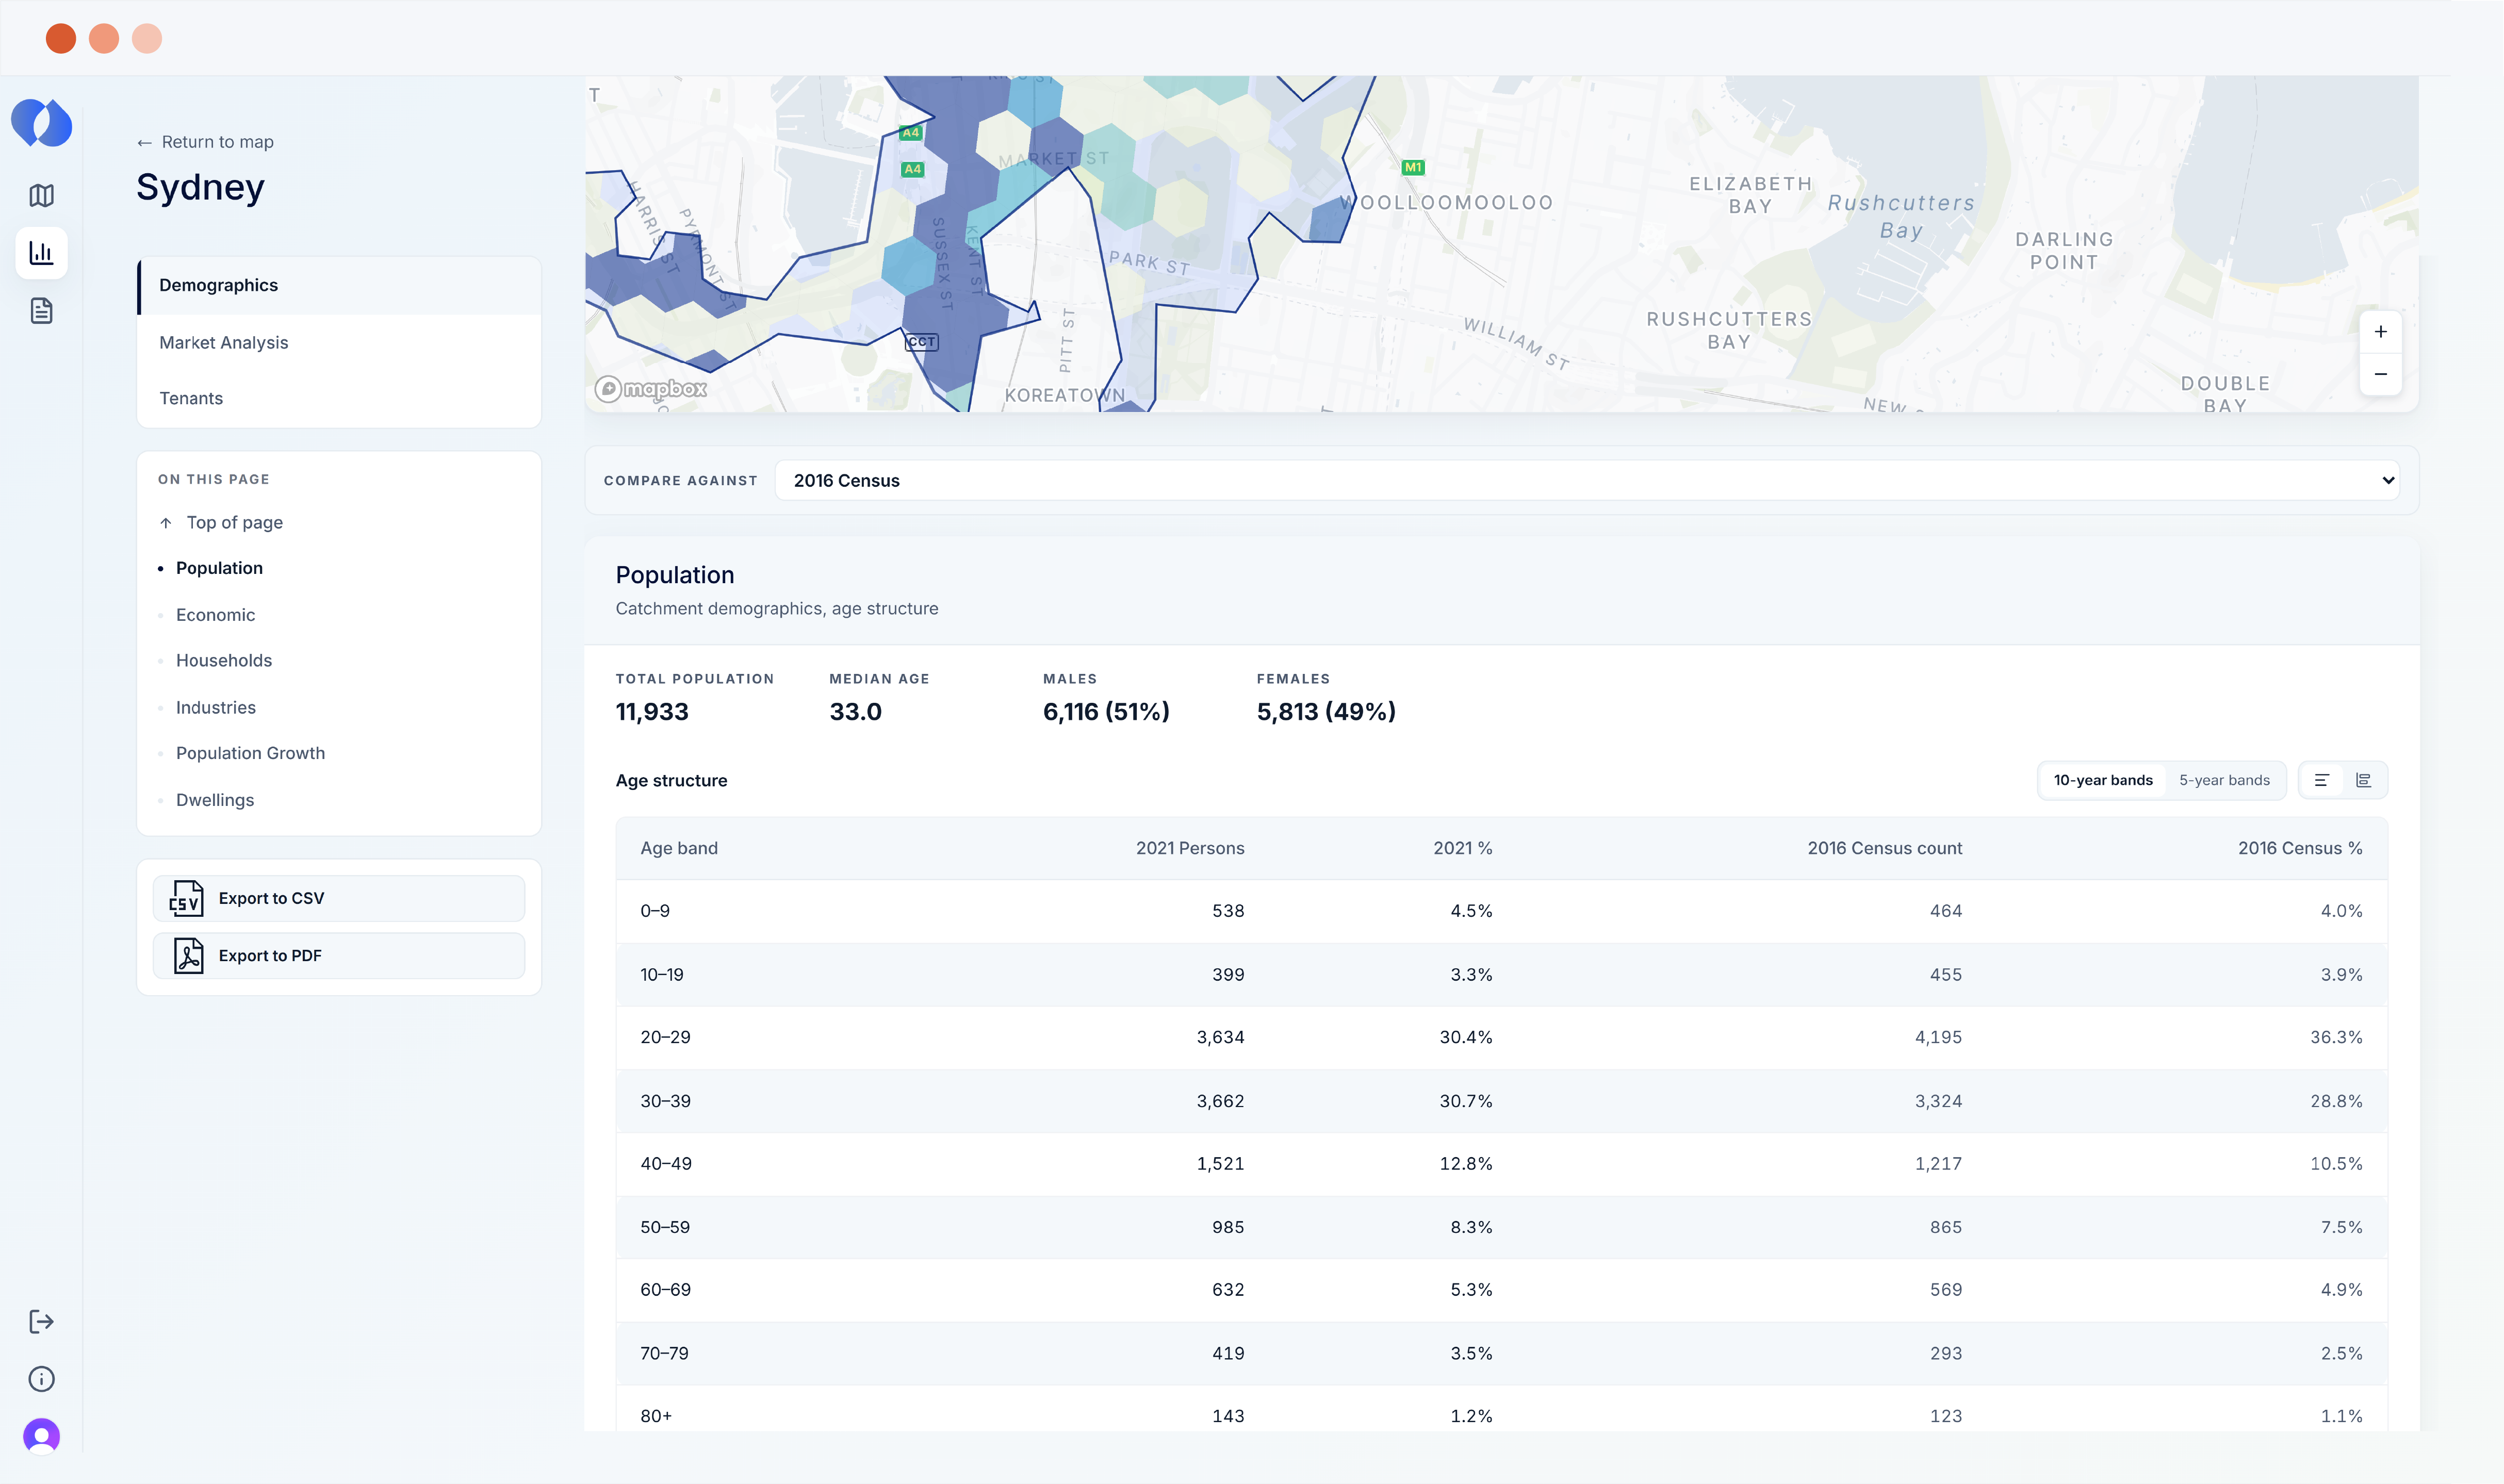
Granular census data analysis
Population, age structure, income bands, household composition, dwelling mix, education, employment and many other variables, apportioned via SA1 capture ratios. Every figure reconciles to the catchment total.
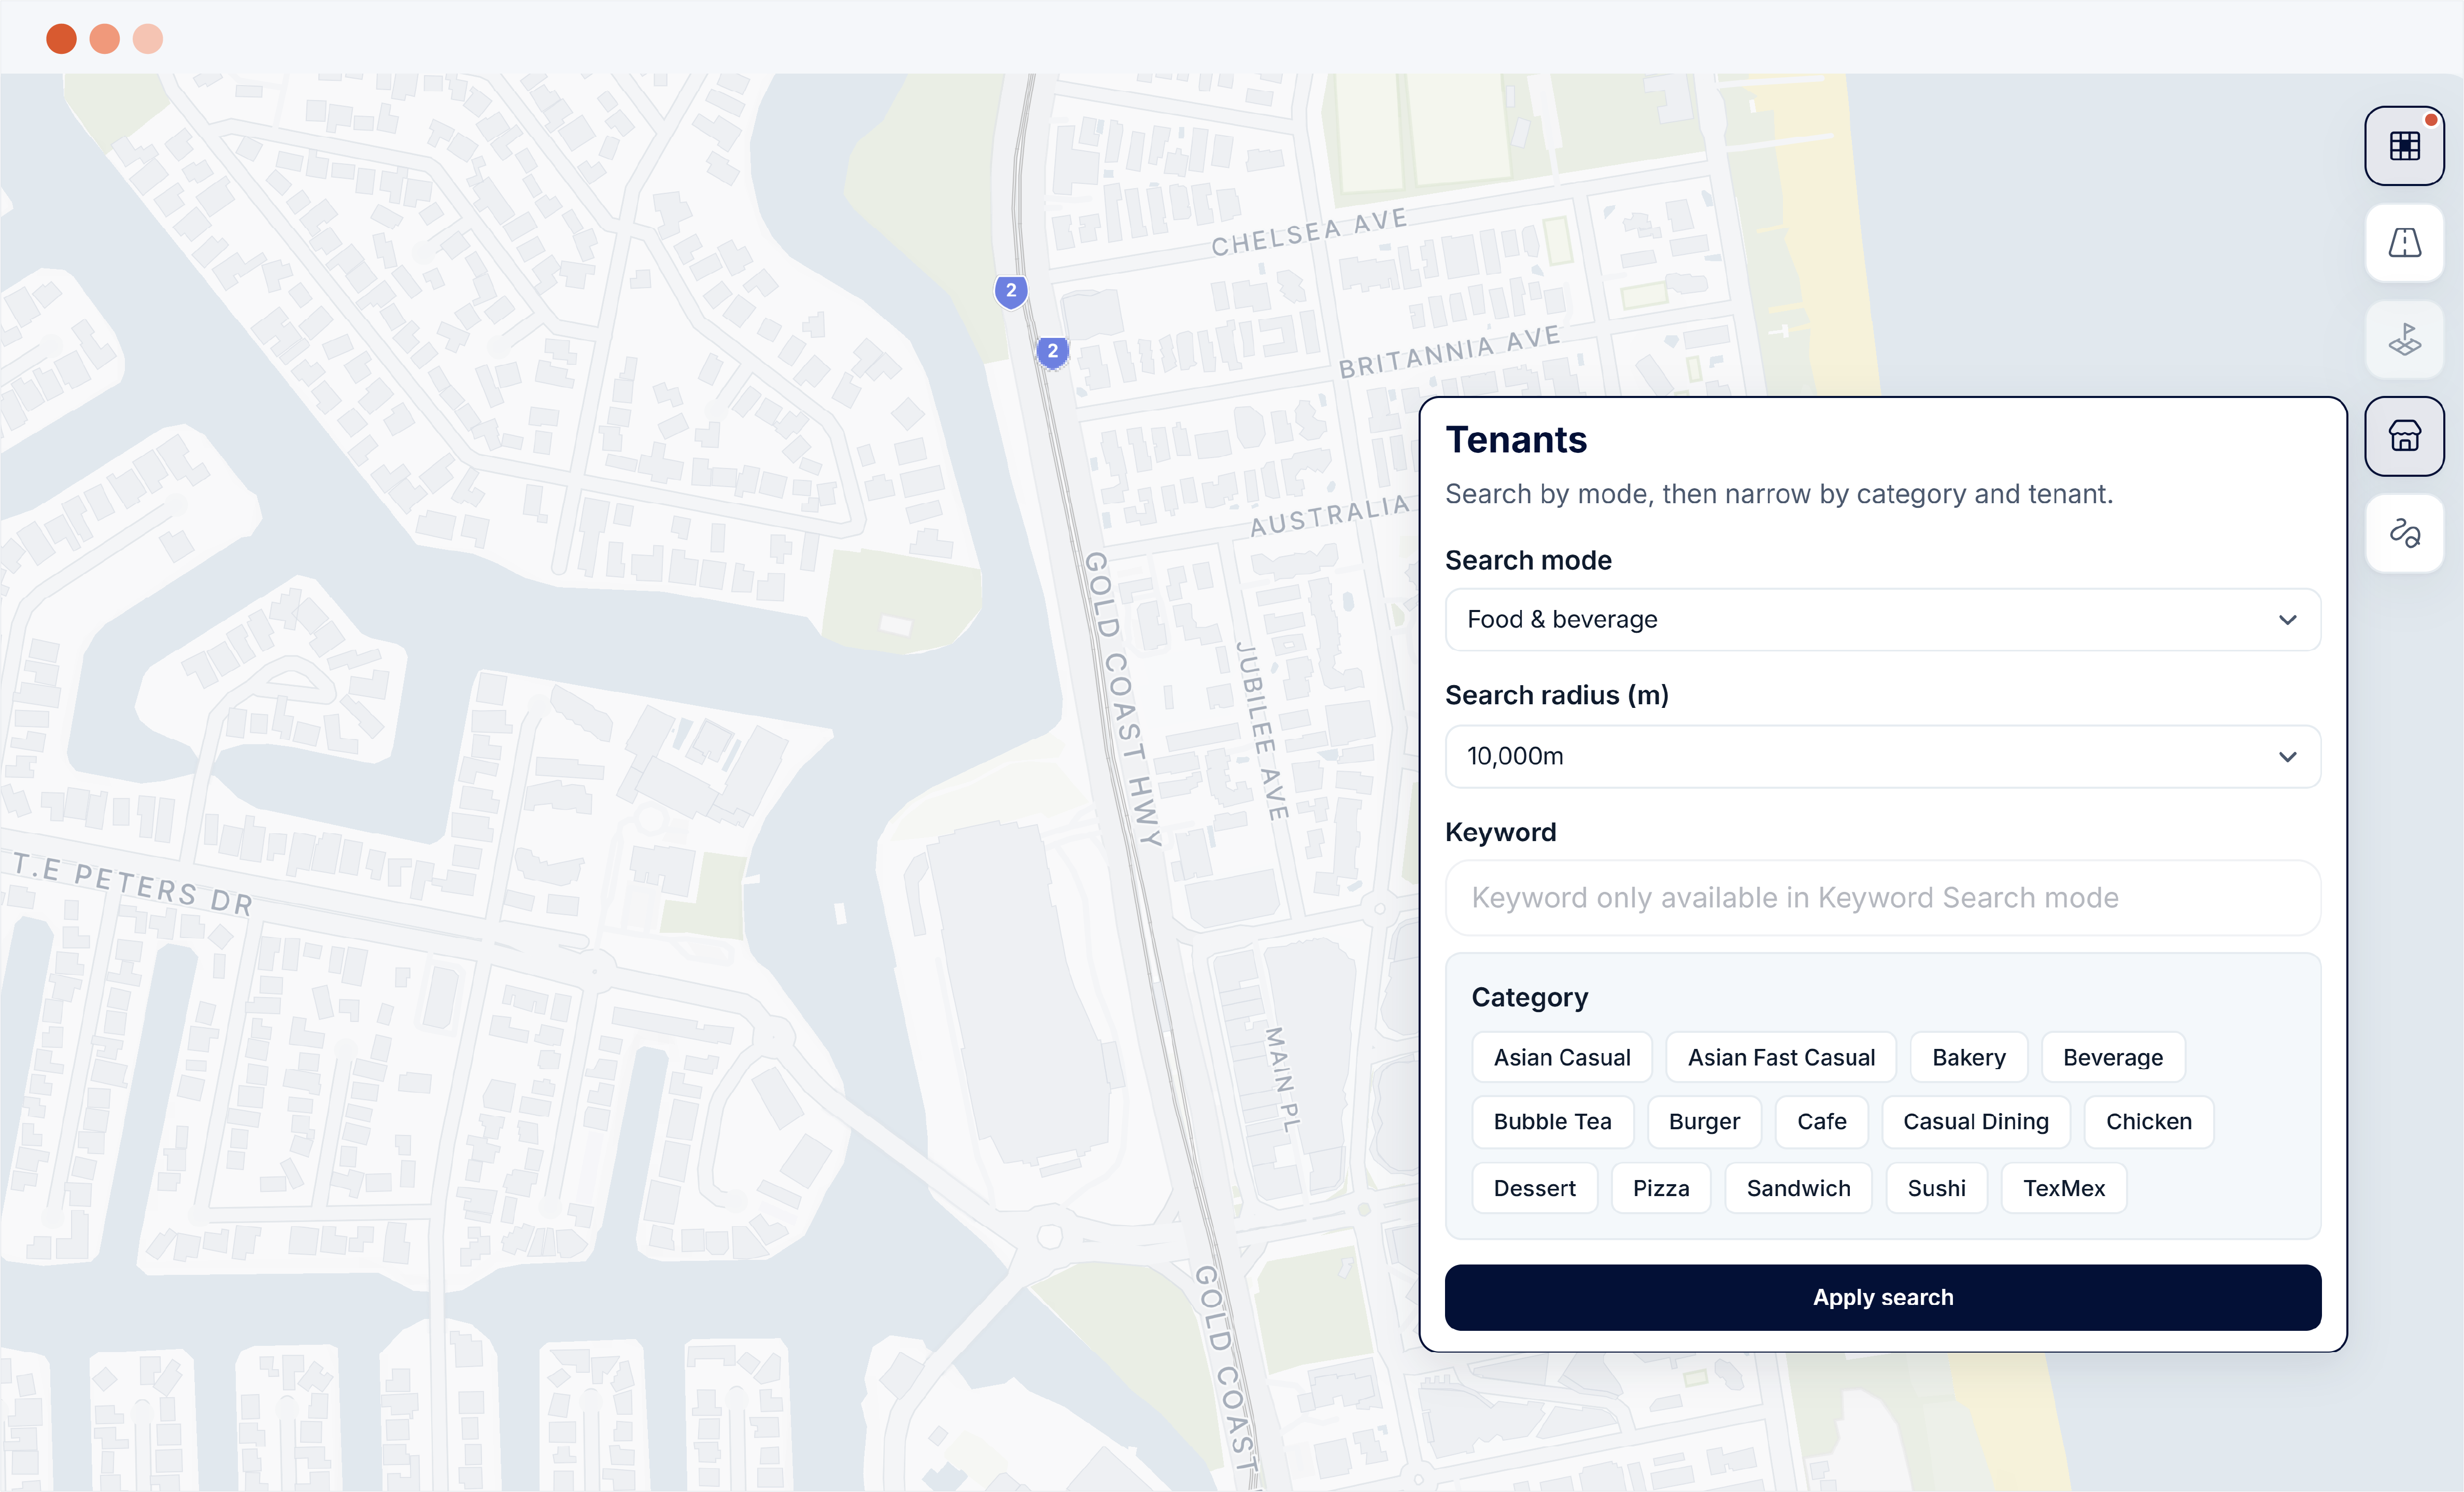
Tenant and competitor mapping
Venue lists across small to large format retail, gyms & wellness, petrol stations, food and beverage, and custom POIs on request. Counts inside the primary and secondary catchments make competitive density immediate.
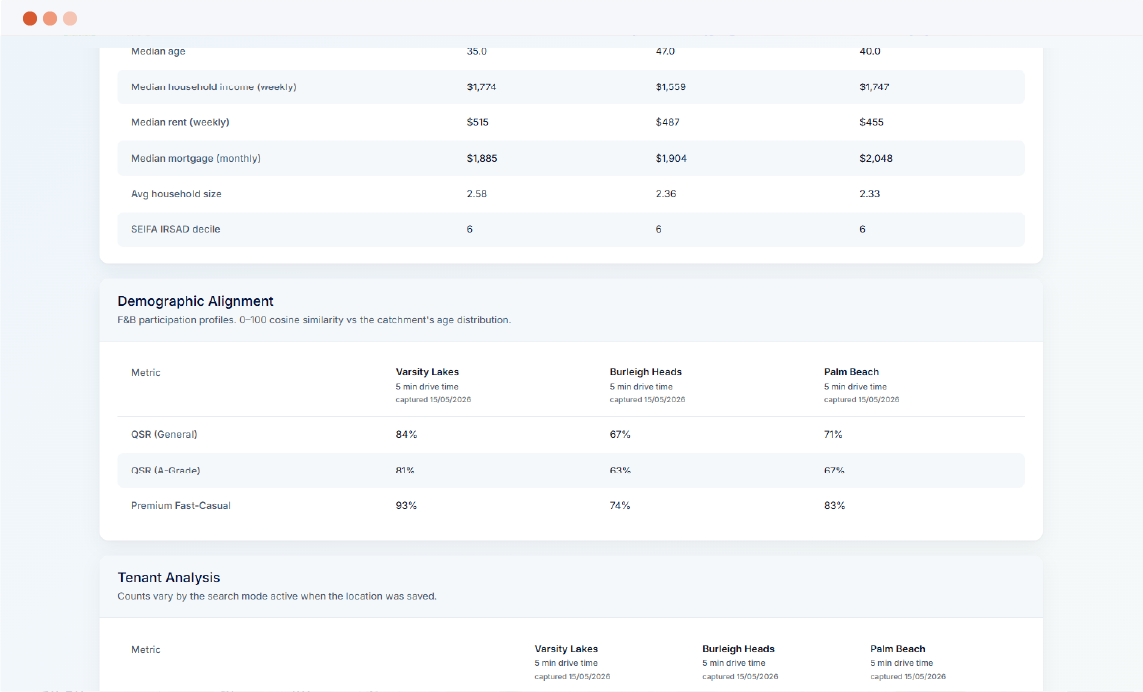
Comparison reports
Save catchment snapshots and stack two or more locations against each other. Side-by-side matrix view across every metric in the analysis.
More than a map.
A map is a feature. This is the system around it. Put a site in front of a property committee and the questions start, about demand, about the store down the road, about whether this one is genuinely better than the other three on the list. SiteGaps answers them in two parts.
The platform
Where does the demand actually come from?
Draw a catchment however you want, drive time, radius, suburb or freehand, and the demographics, competitors, spend and exposure populate underneath it. Then stack your shortlist side by side.
- Catchments by drive time, radius, suburb or polygon
- Demographics, competitors, spend and exposure on one map
- Side-by-side comparison across every site on the list
- Self-serve from A$220/month, no procurement cycle
SiteGaps IQ
What share of that catchment can this site actually win?
IQ models capture rate against your own network rather than a generic benchmark. Turnover turned out to be unpredictable and capture rate did not, so capture rate is what it forecasts.
- Trained on your existing stores, and validated against them first
- Cannibalisation and territory impact before you commit to a lease
- Every driver visible: competition, catchment population, age profile
Site selection for every kind of network.
Retail site selection
Match stores to customer profile. Identify gaps in network footprint. Avoid cannibalising existing trade areas.
Restaurant and QSR site selection
Forecast traffic, model drive-time cannibalisation, score every available pad against your top-performing stores.
Fitness and wellness site selection
Locate underserved fitness markets with the right age-band and income mix. Trade off catchment size against competitor saturation.
Fuel and convenience site selection
Catchment population, traffic count and competitor density on one map. Site-by-site demand modelling for the convenience retail mix.
Property and mixed-use site selection
Demand sizing for retail tenants, demographic fit for residential, walk-time and drive-time accessibility for office. One report covers all three.
Demographic intel at 150m granularity
Population, age, income and household profiles resolved to roughly 150 metres, then apportioned to whatever catchment you draw. State benchmarks and five-year change sit alongside every figure.
Self-serve from day one
Sign up and you’re in the product the same day. No procurement cycle, no implementation fee, no GIS engineer to onboard.
48 hours to first recommendation
From network upload to first ranked recommendation across a multi-site shortlist. Pricing is published on the pricing page.
How SiteGaps compares.
Seven platforms and consultancies serve the Australian site selection market. Only one lets you sign up yourself, at a price published on the page, with predictive modelling built into the product rather than sold as a consulting engagement.
| Capability | SiteGaps | GapMaps | Geotech Information Services | Spectrum Analysis | Placer.ai (US only) | Colliers LocationIQ | GrowthFactor (US only) |
|---|---|---|---|---|---|---|---|
| Getting started | Self-serve | Book a demo | Scoped engagement | Scoped engagement | Sales-led | Contact | Self-serve |
| What it costs | A$220/mo, published | Quote on request | Per engagement | Per engagement | Quote on request | Quote on request | Quote on request |
| Catchment types | All four | Travel-time, radius | Analyst-defined | Analyst-defined | Drive-time | Radial, polygon, drive-time | All four |
| Predictive modelling | In-platform & consulting | — | Consulting | Consulting | — | — | Consulting |
| Foot traffic | Modelled | Visitation data | Device data | — | Device data | — | Foot + vehicle |
| Cannibalisation analysis | In-platform | Impact Analysis tool | Consulting | Consulting | — | Consulting | In-app & consulting |
| Territory planning | Via SiteGaps IQ | Territory mapping | — | With exclusion zones | — | Consulting | In-app & consulting |
| Australian data | Australia only | AU + 20 countries | AU, NZ, SE Asia | Australia | US only | Australia | US only |
Each cell describes what that vendor’s own public material shows, as of 2026. “—” means we could not find it documented publicly, not that it does not exist. Spectrum Analysis and Geotech Information Services are consultancies rather than self-serve software. Confirm current detail with each provider.
Frequently asked questions about site selection.
What is site selection?
What are the criteria for site selection?
Why is site selection important?
How do you choose a site for a business?
What software is used for site selection?
How long does site selection take?
How much does site selection software cost?
How is SiteGaps different from other site selection tools?
What is onboarding like?
How do I know the forecasts are any good?
Start your next site selection today.
Sign up and start evaluating sites the same day. Self-serve, no GIS engineer required, pricing on the page.