Location intelligence for site decisions.
SiteGaps brings demographics, demand, and competitor coverage onto a single map, and packages the lot into a clean, sharable analysis report.
An expanding number of layers in one platform.
Built to answer one question end-to-end: where should I open next, and what does the catchment look like?
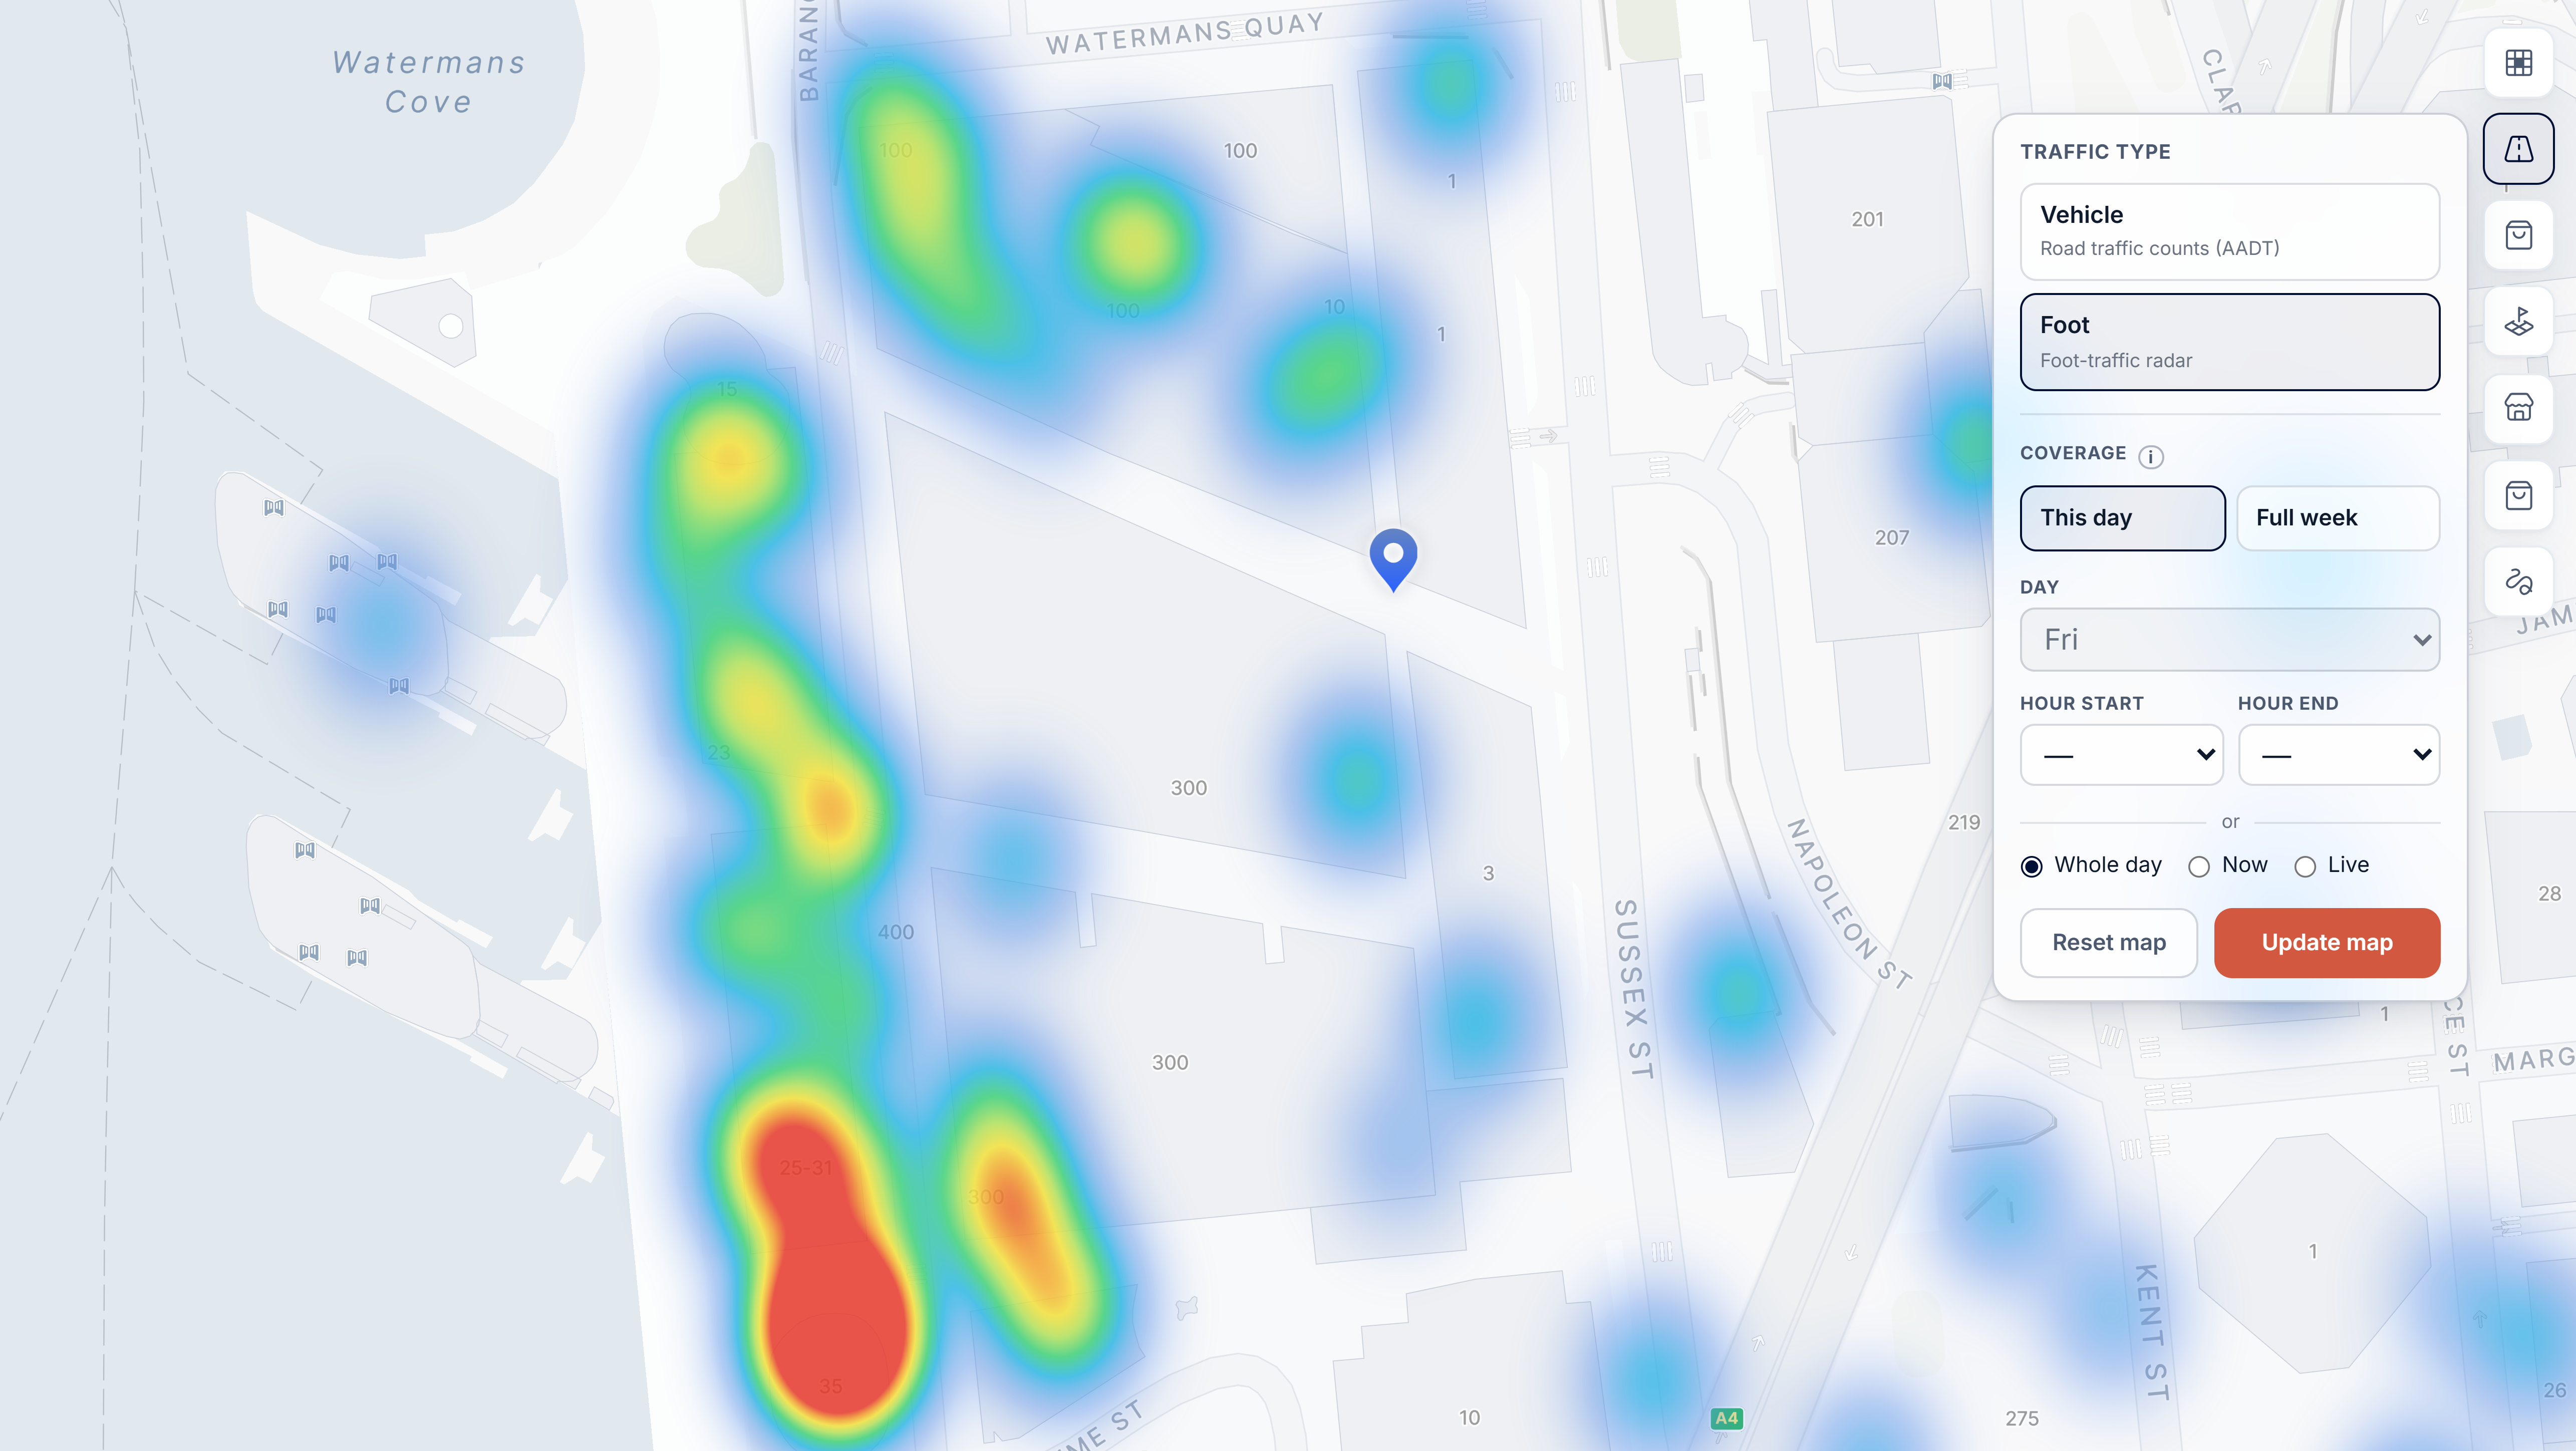

Foot traffic on demand.
We proxy location demand signals through BestTime alongside additional mobile device GPS providers, giving you a cross-validated read on footfall across your trade area.
- Expose the busiest areas down to the storefront level
- Filter by weekday and a specific hour range
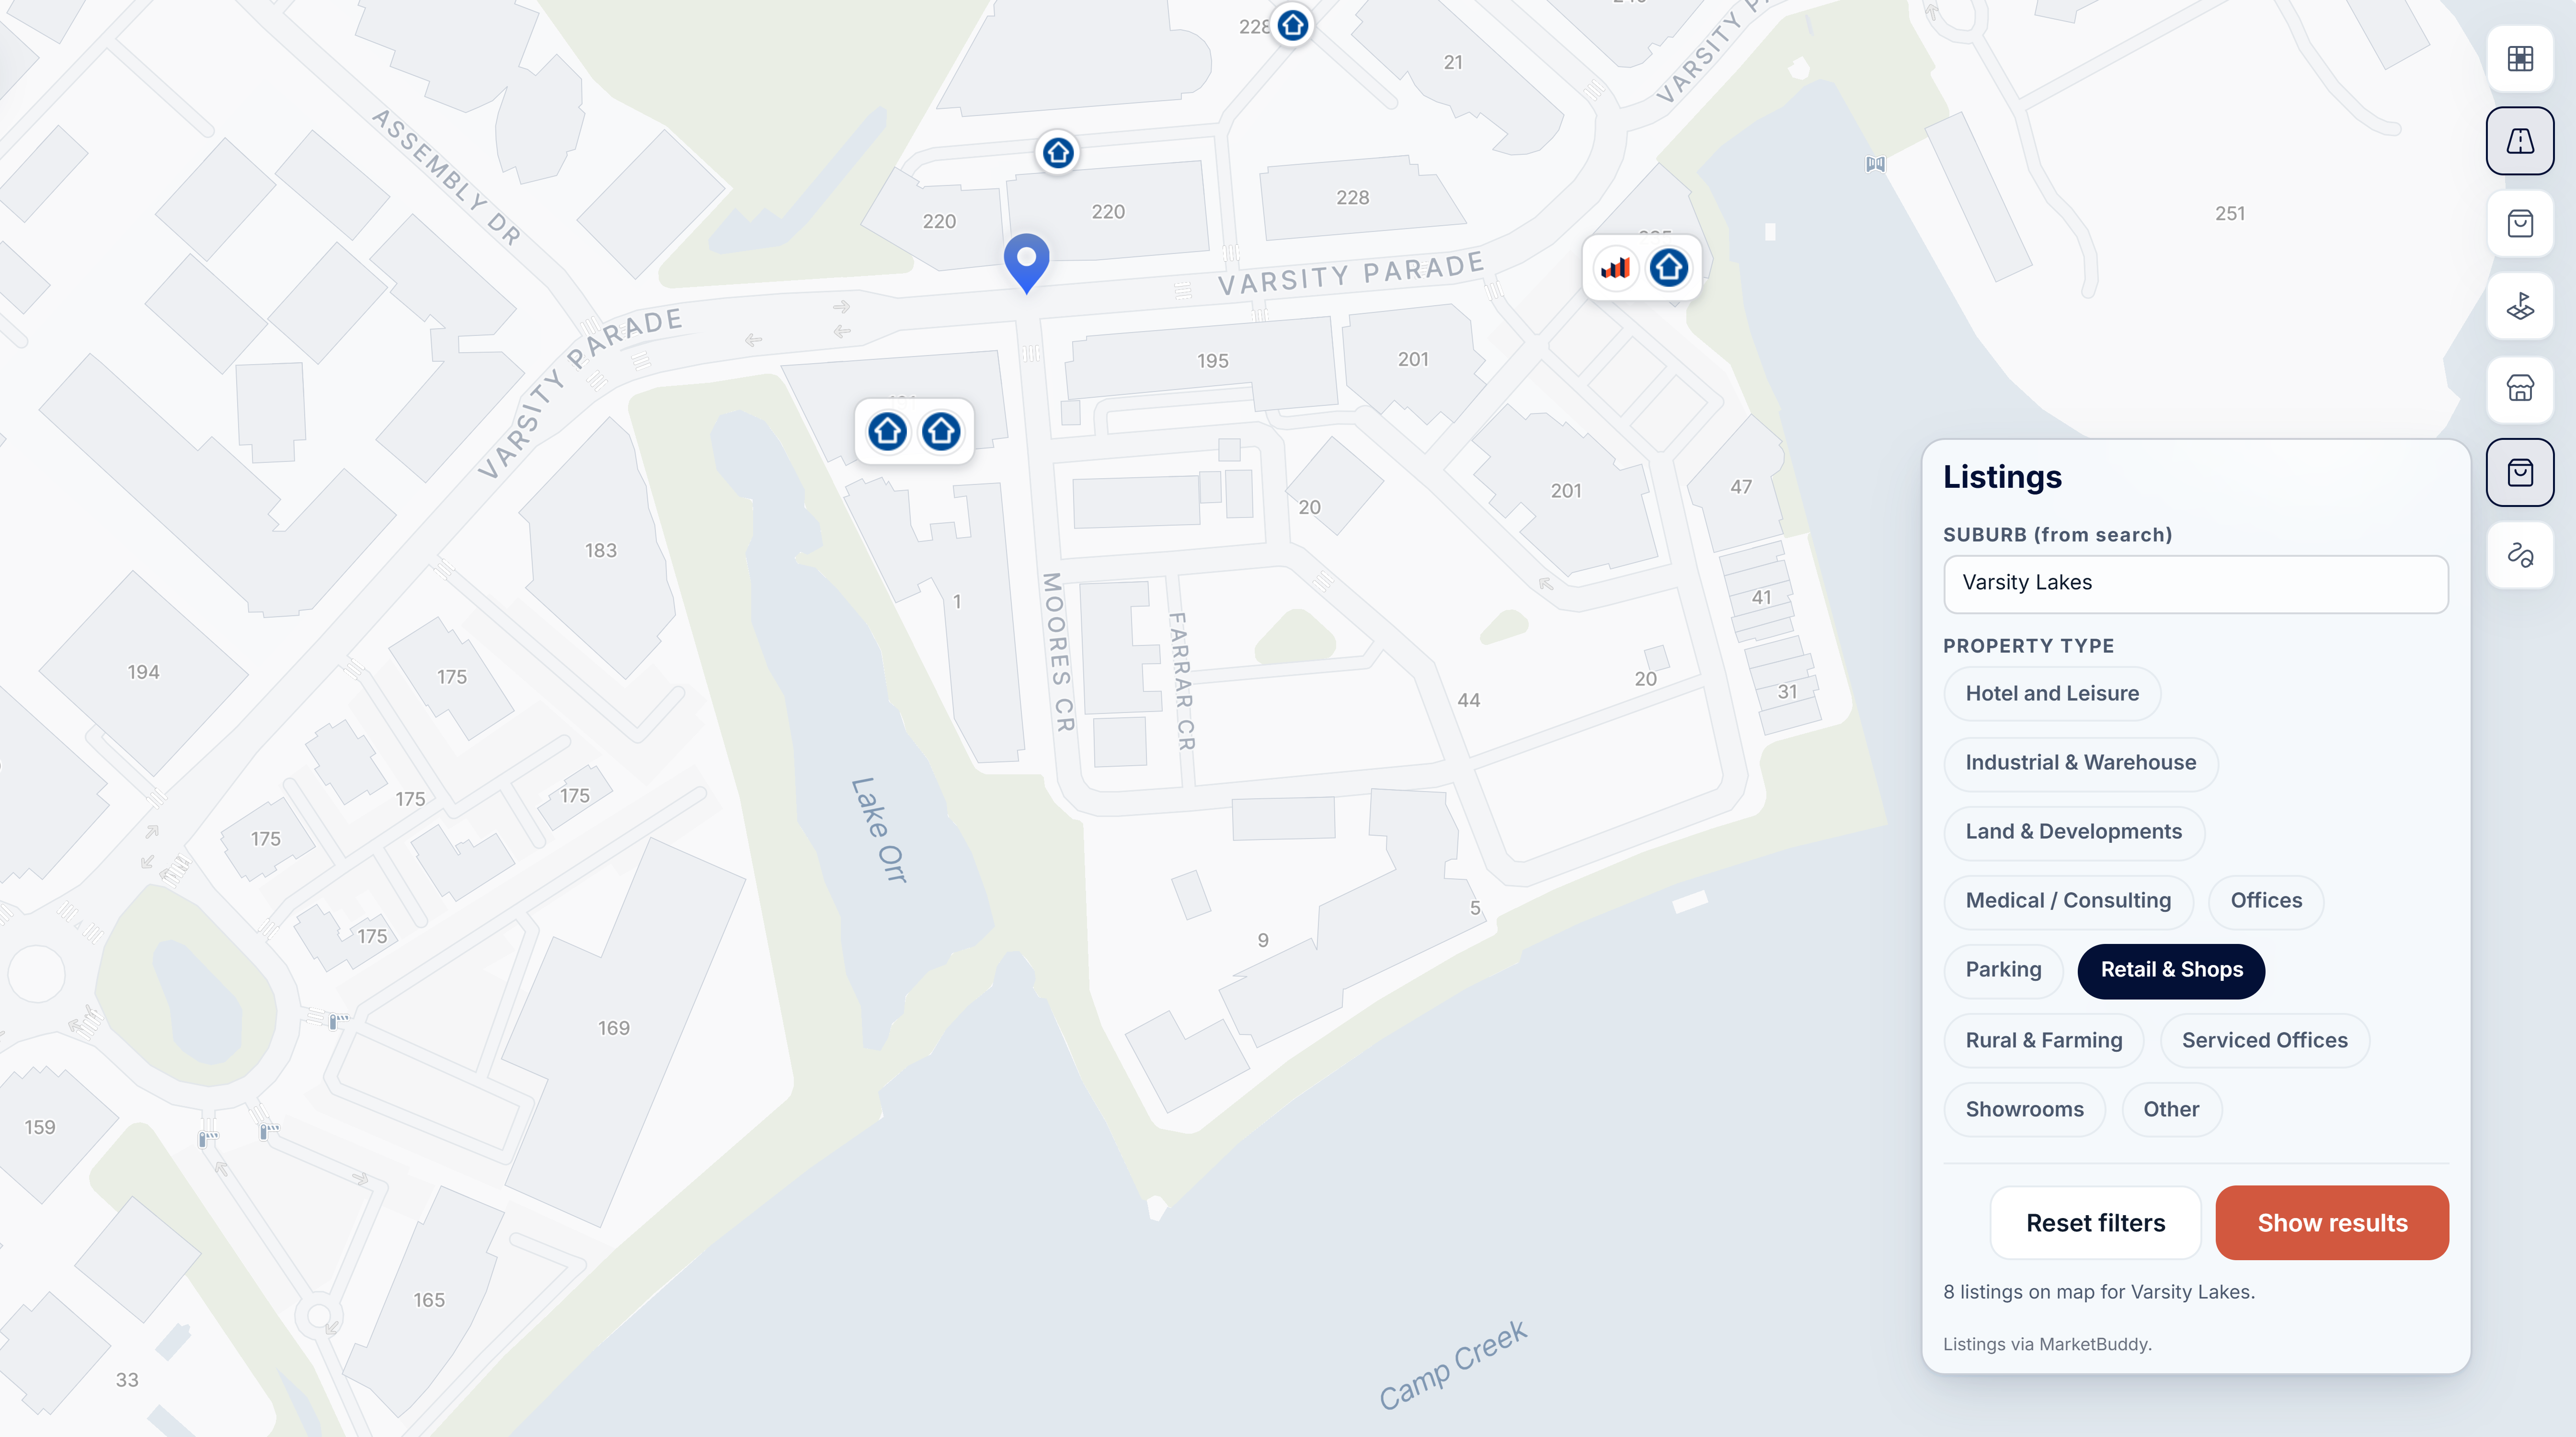

See what's genuinely on the market.
Retail, industrial, land, offices and more, surfaced inside the platform so you can weigh live availability against your catchment without leaving the map.
- Live commercial listings sourced across Australia
- Filter by suburb, sector, floor area and price
- Per-square-metre rates kept up to date daily
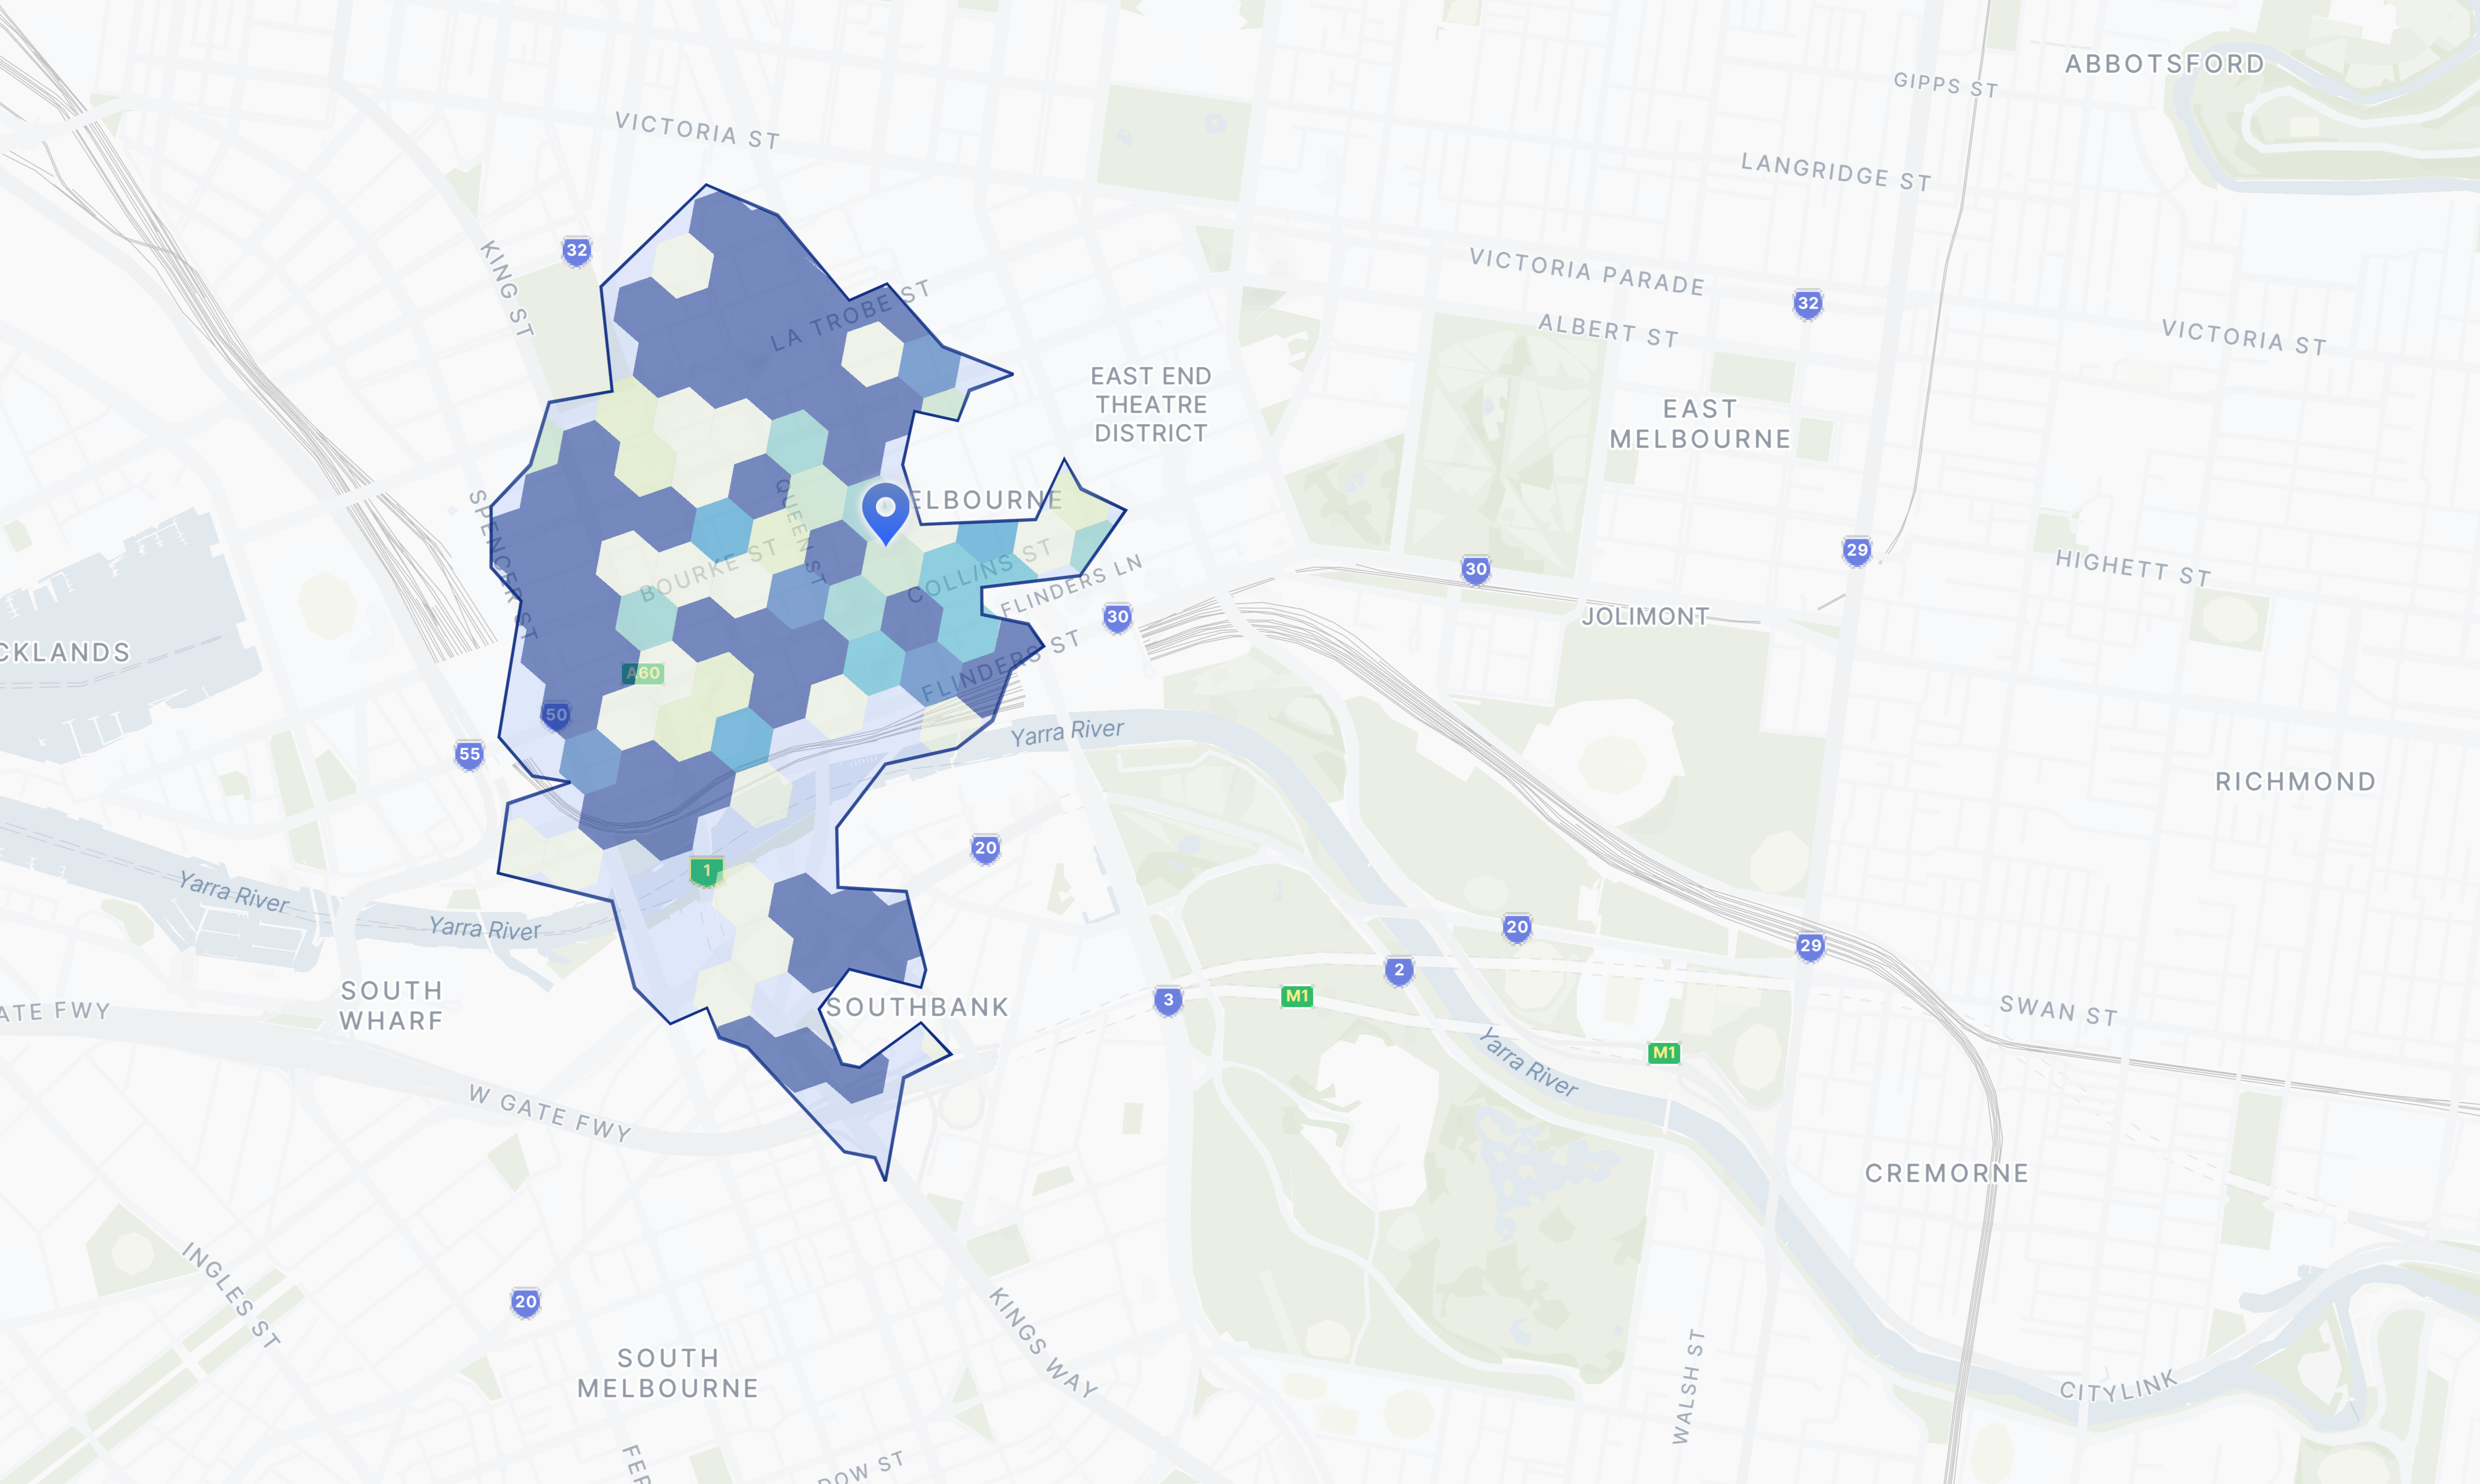

Define the catchment any way you draw it.
Drive time isochrones, radius circles, suburb boundaries, or a hand-drawn polygon. Every catchment shape feeds the same demographic and supply pipeline so the rest of the report stays consistent.
- Drive time isolines with traffic-aware profiles
- Council, suburb, and many more boundary levels of analysis
- Custom trade area tool
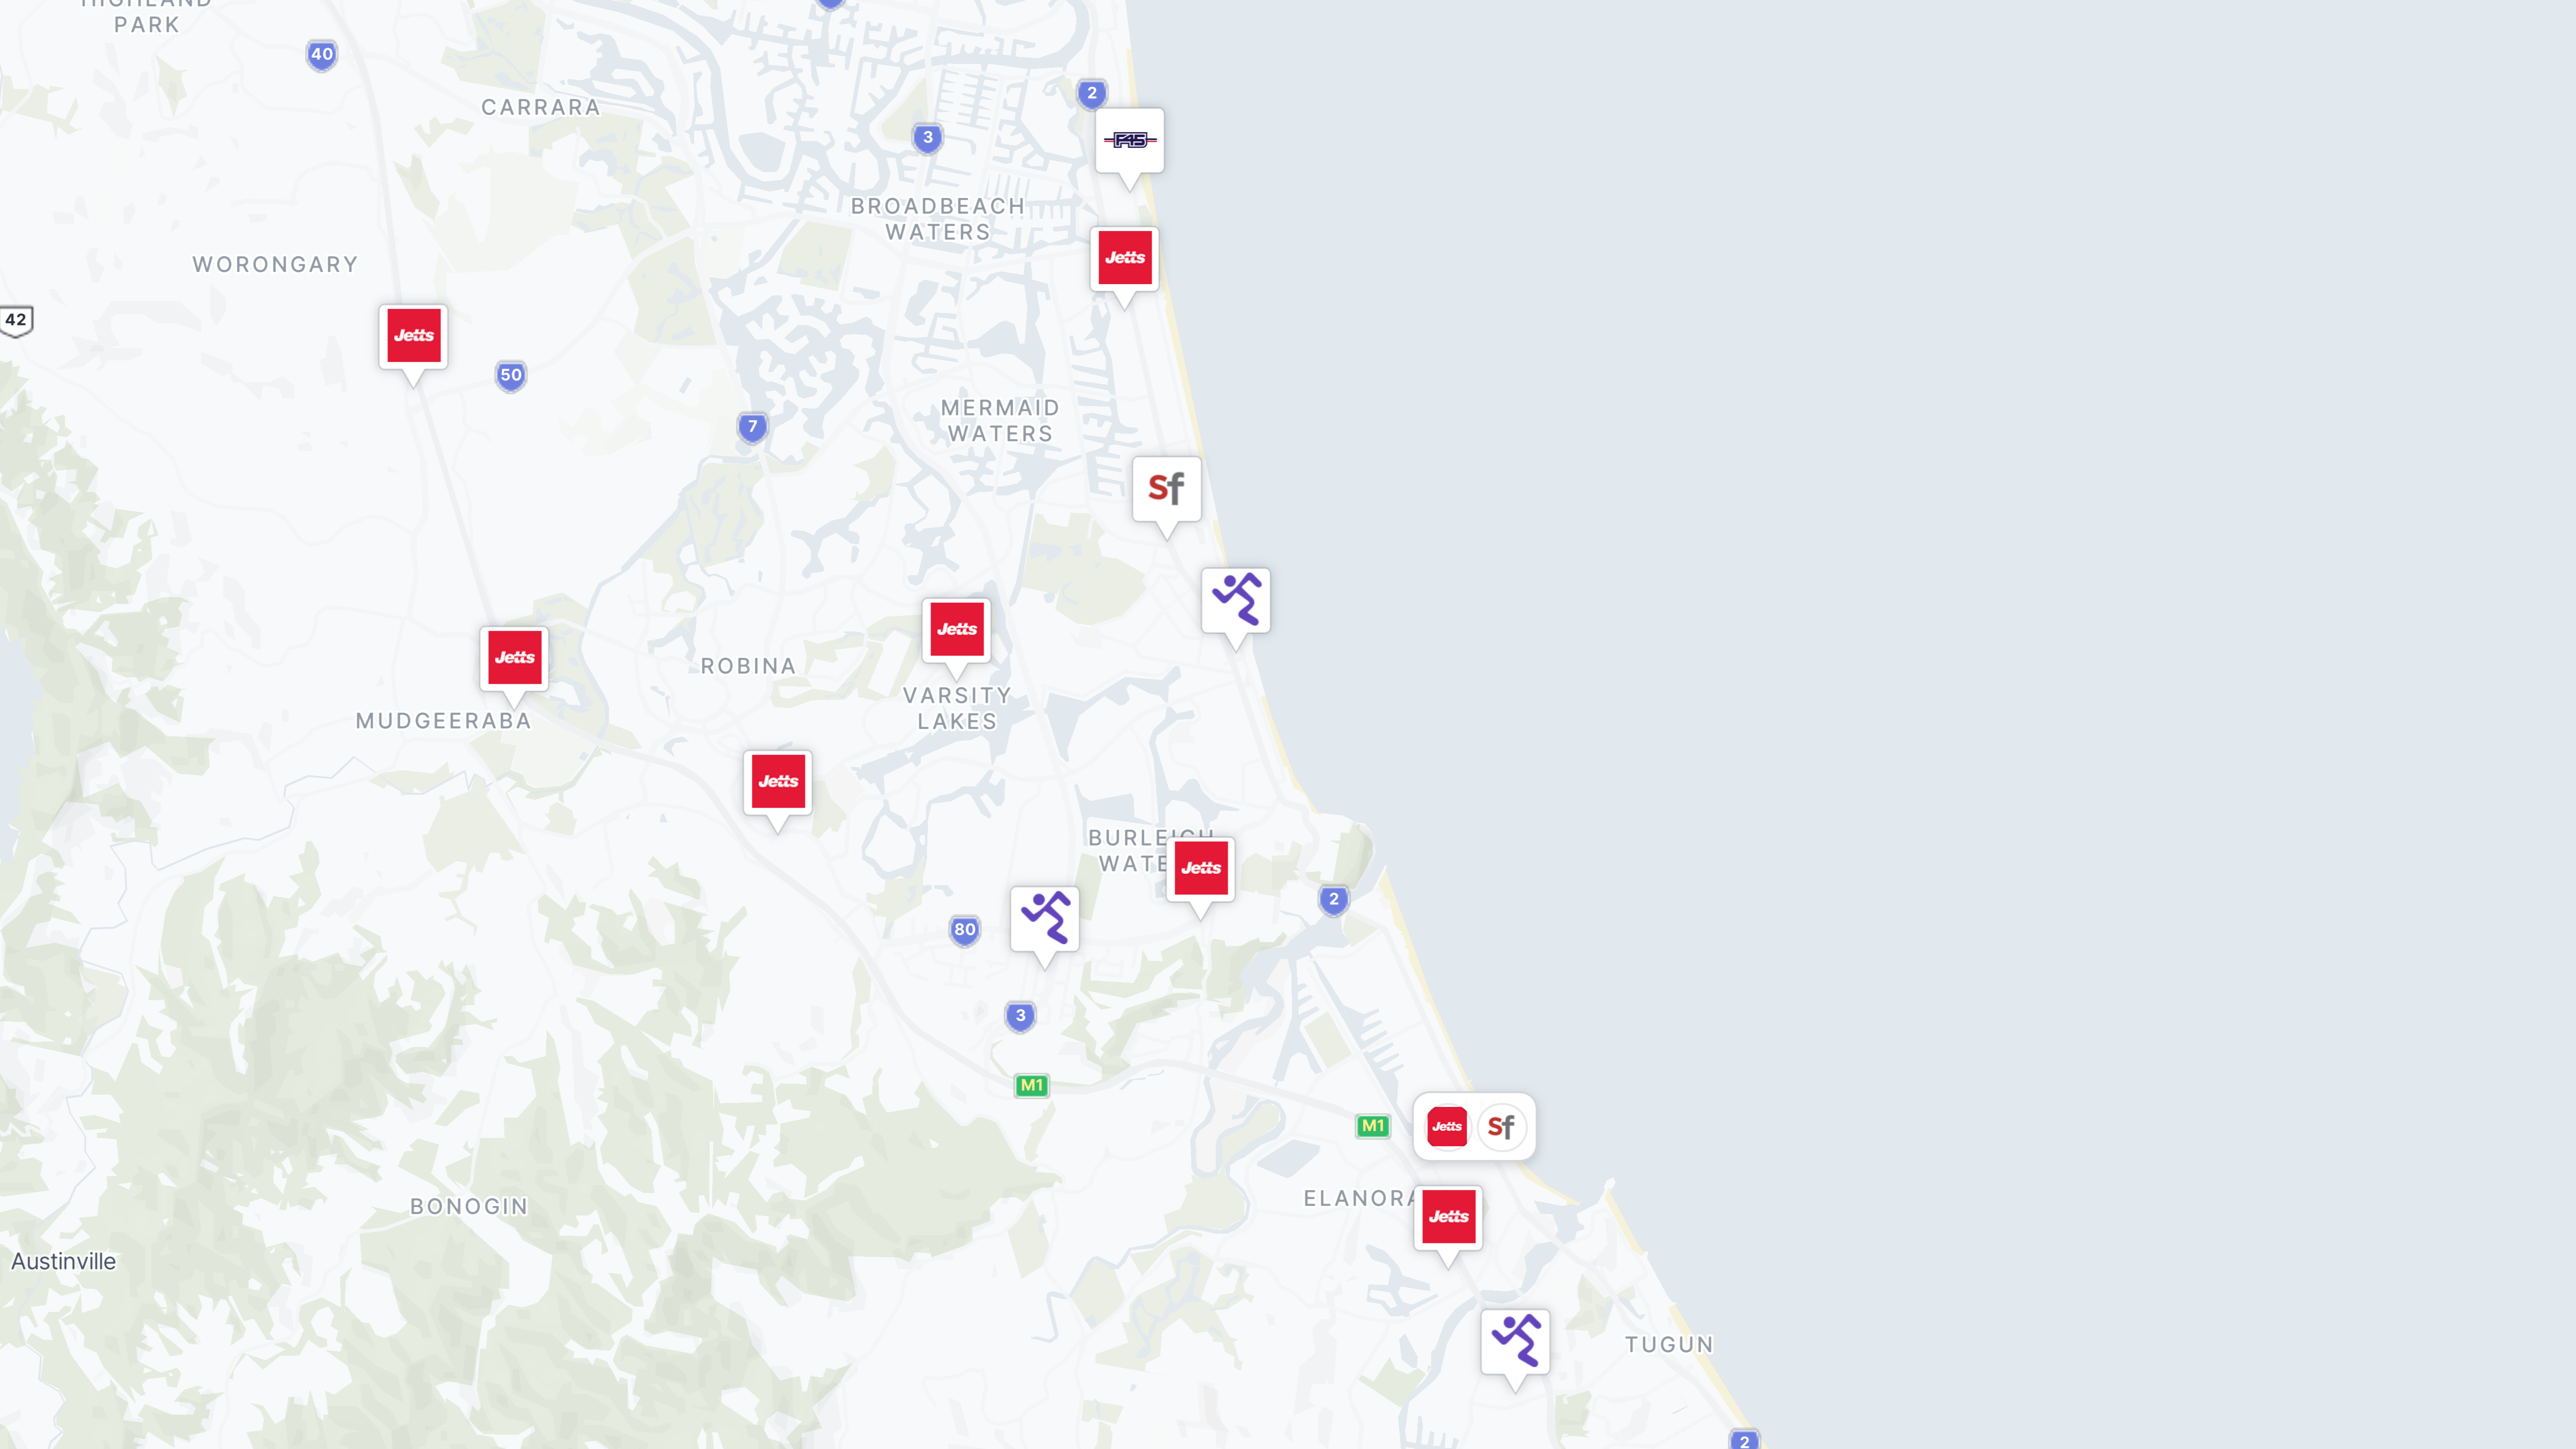

Map the competitors that matter.
Any Point of Interest geocoded for your specific use case, across small to large format retail, gyms & wellness, petrol stations, food and beverage, and more.
- Direct & indirect competitors, mapped at your request
- Interactive competitor markers, with instant cannibalisation analysis
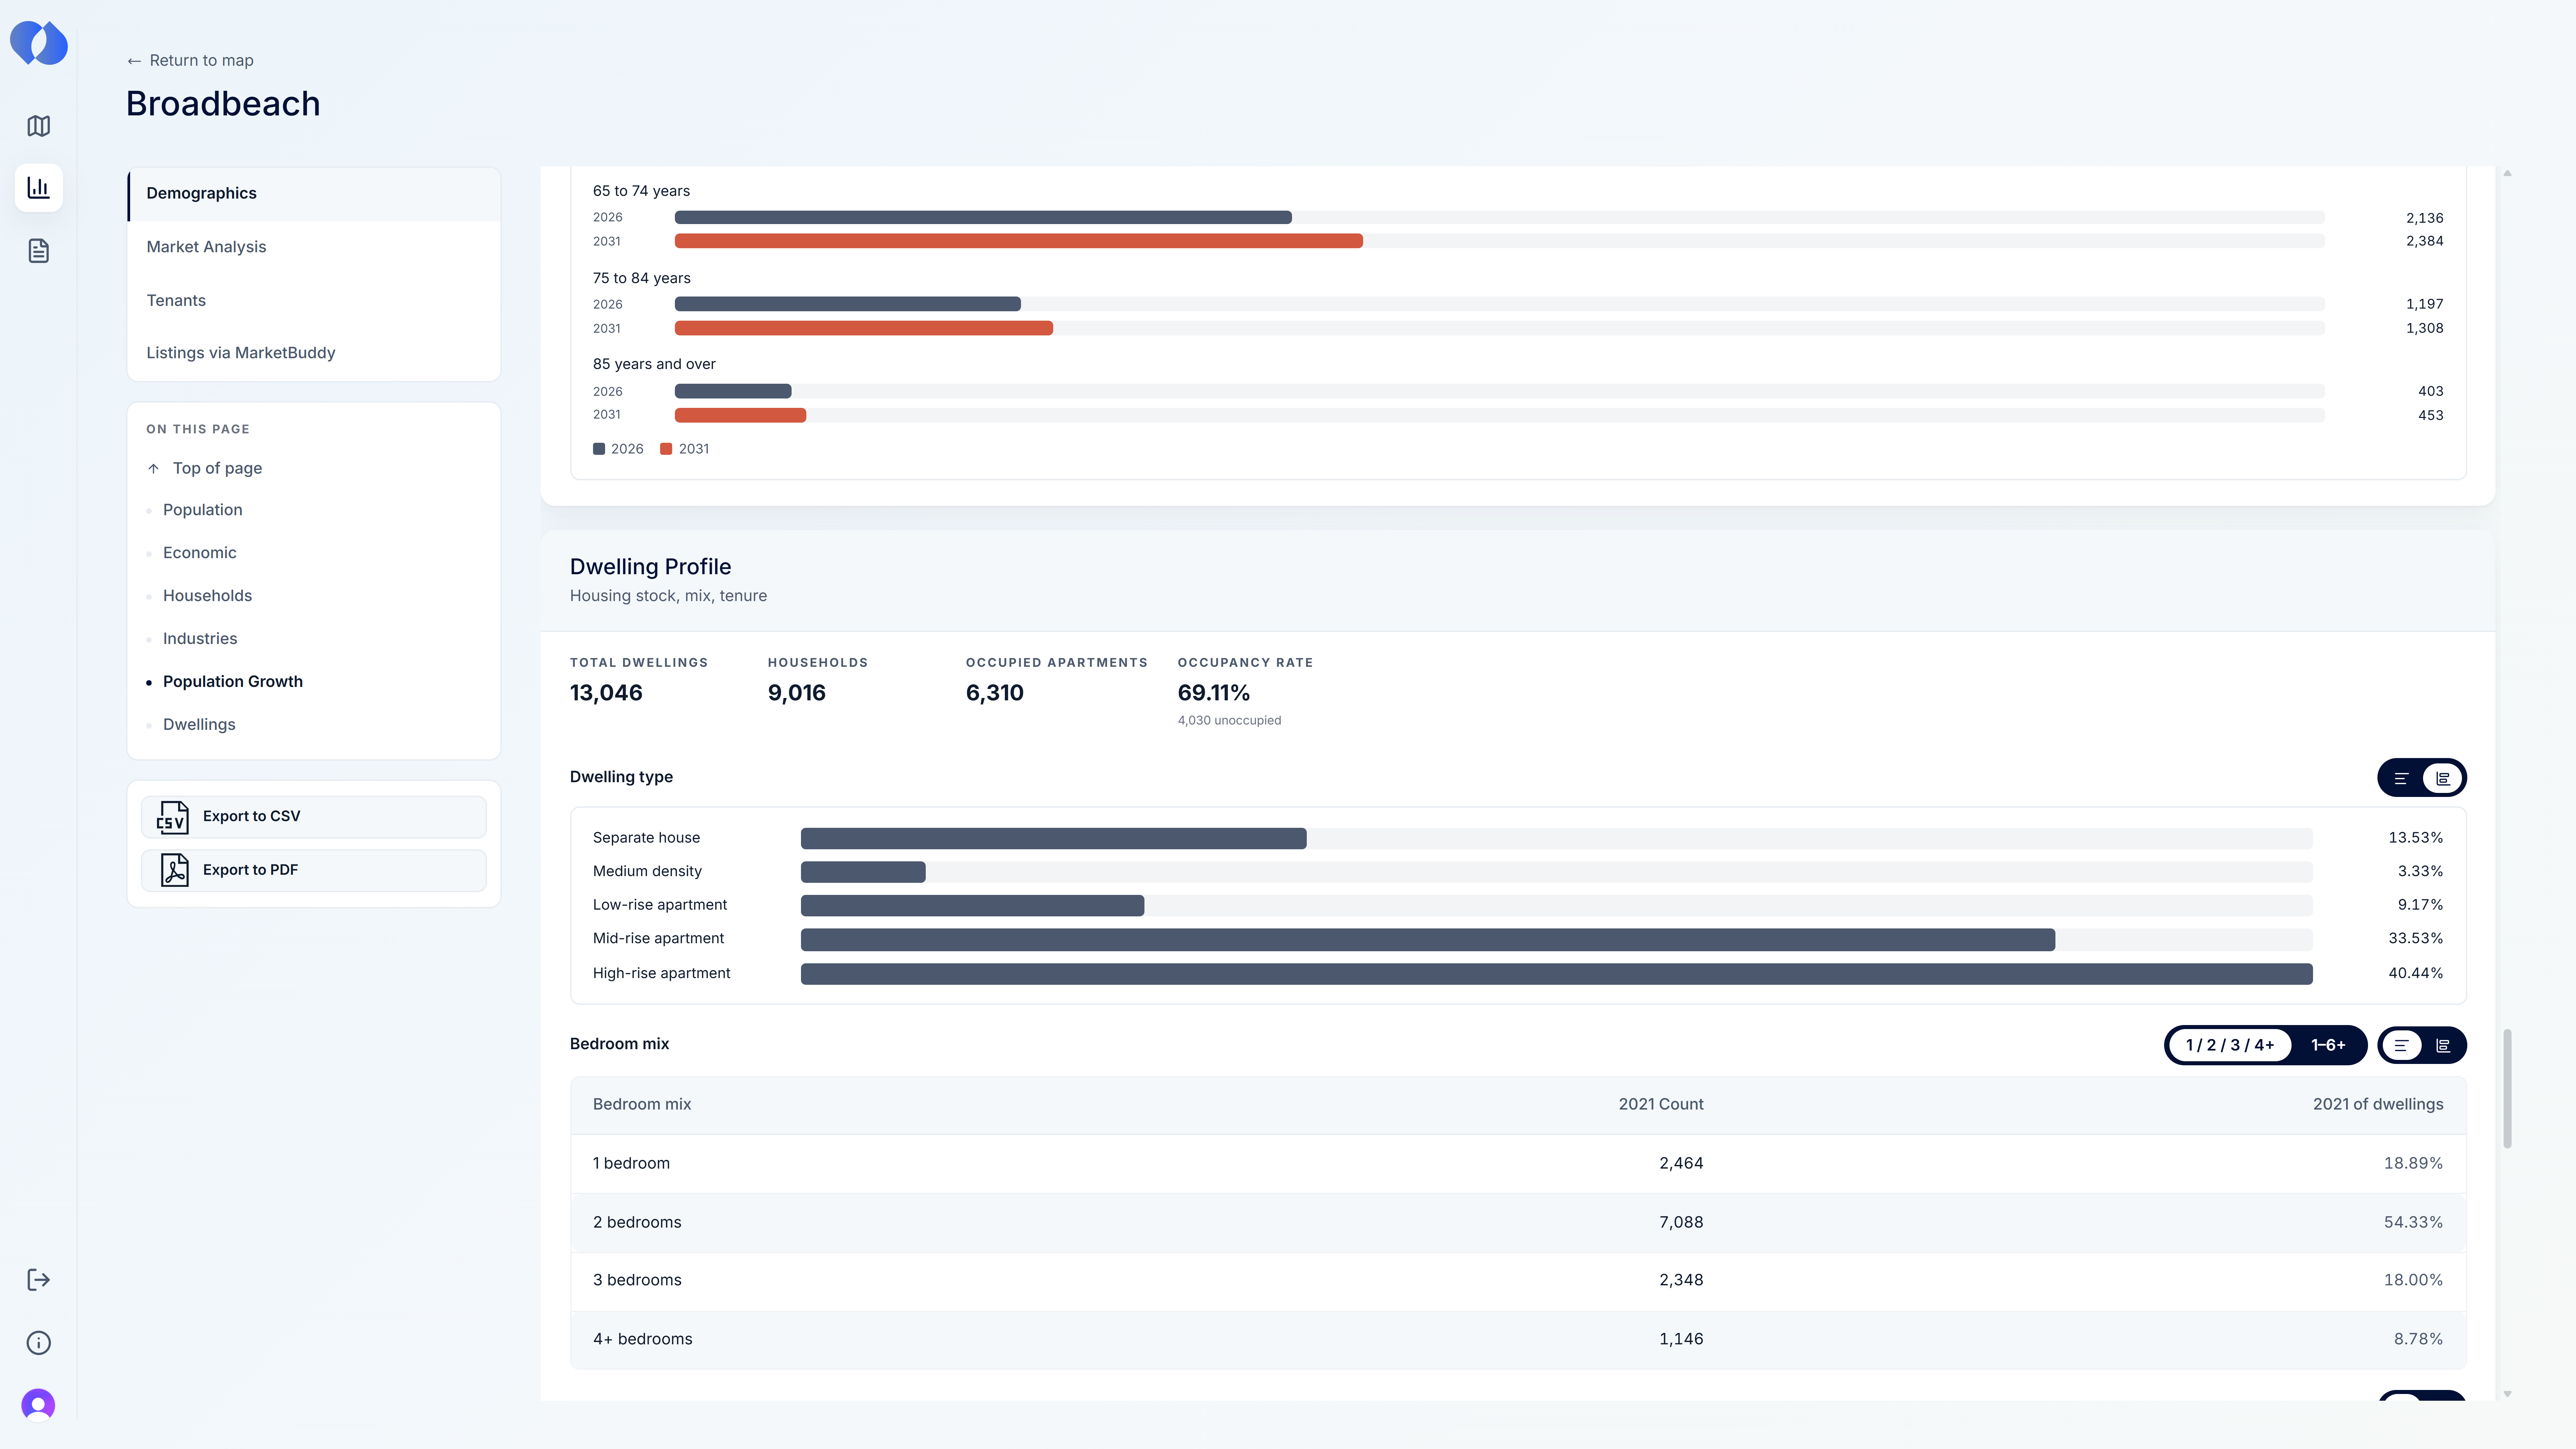

Granular census data analysis.
Population, age structure, income bands, household composition, dwelling mix, education, employment and many other variables, apportioned into your catchment. Every figure reconciles to the headline total.
- 20+ data tables across 6 demographic sections
- State benchmark + 2016 census comparison columns
- Population growth projections through 2032
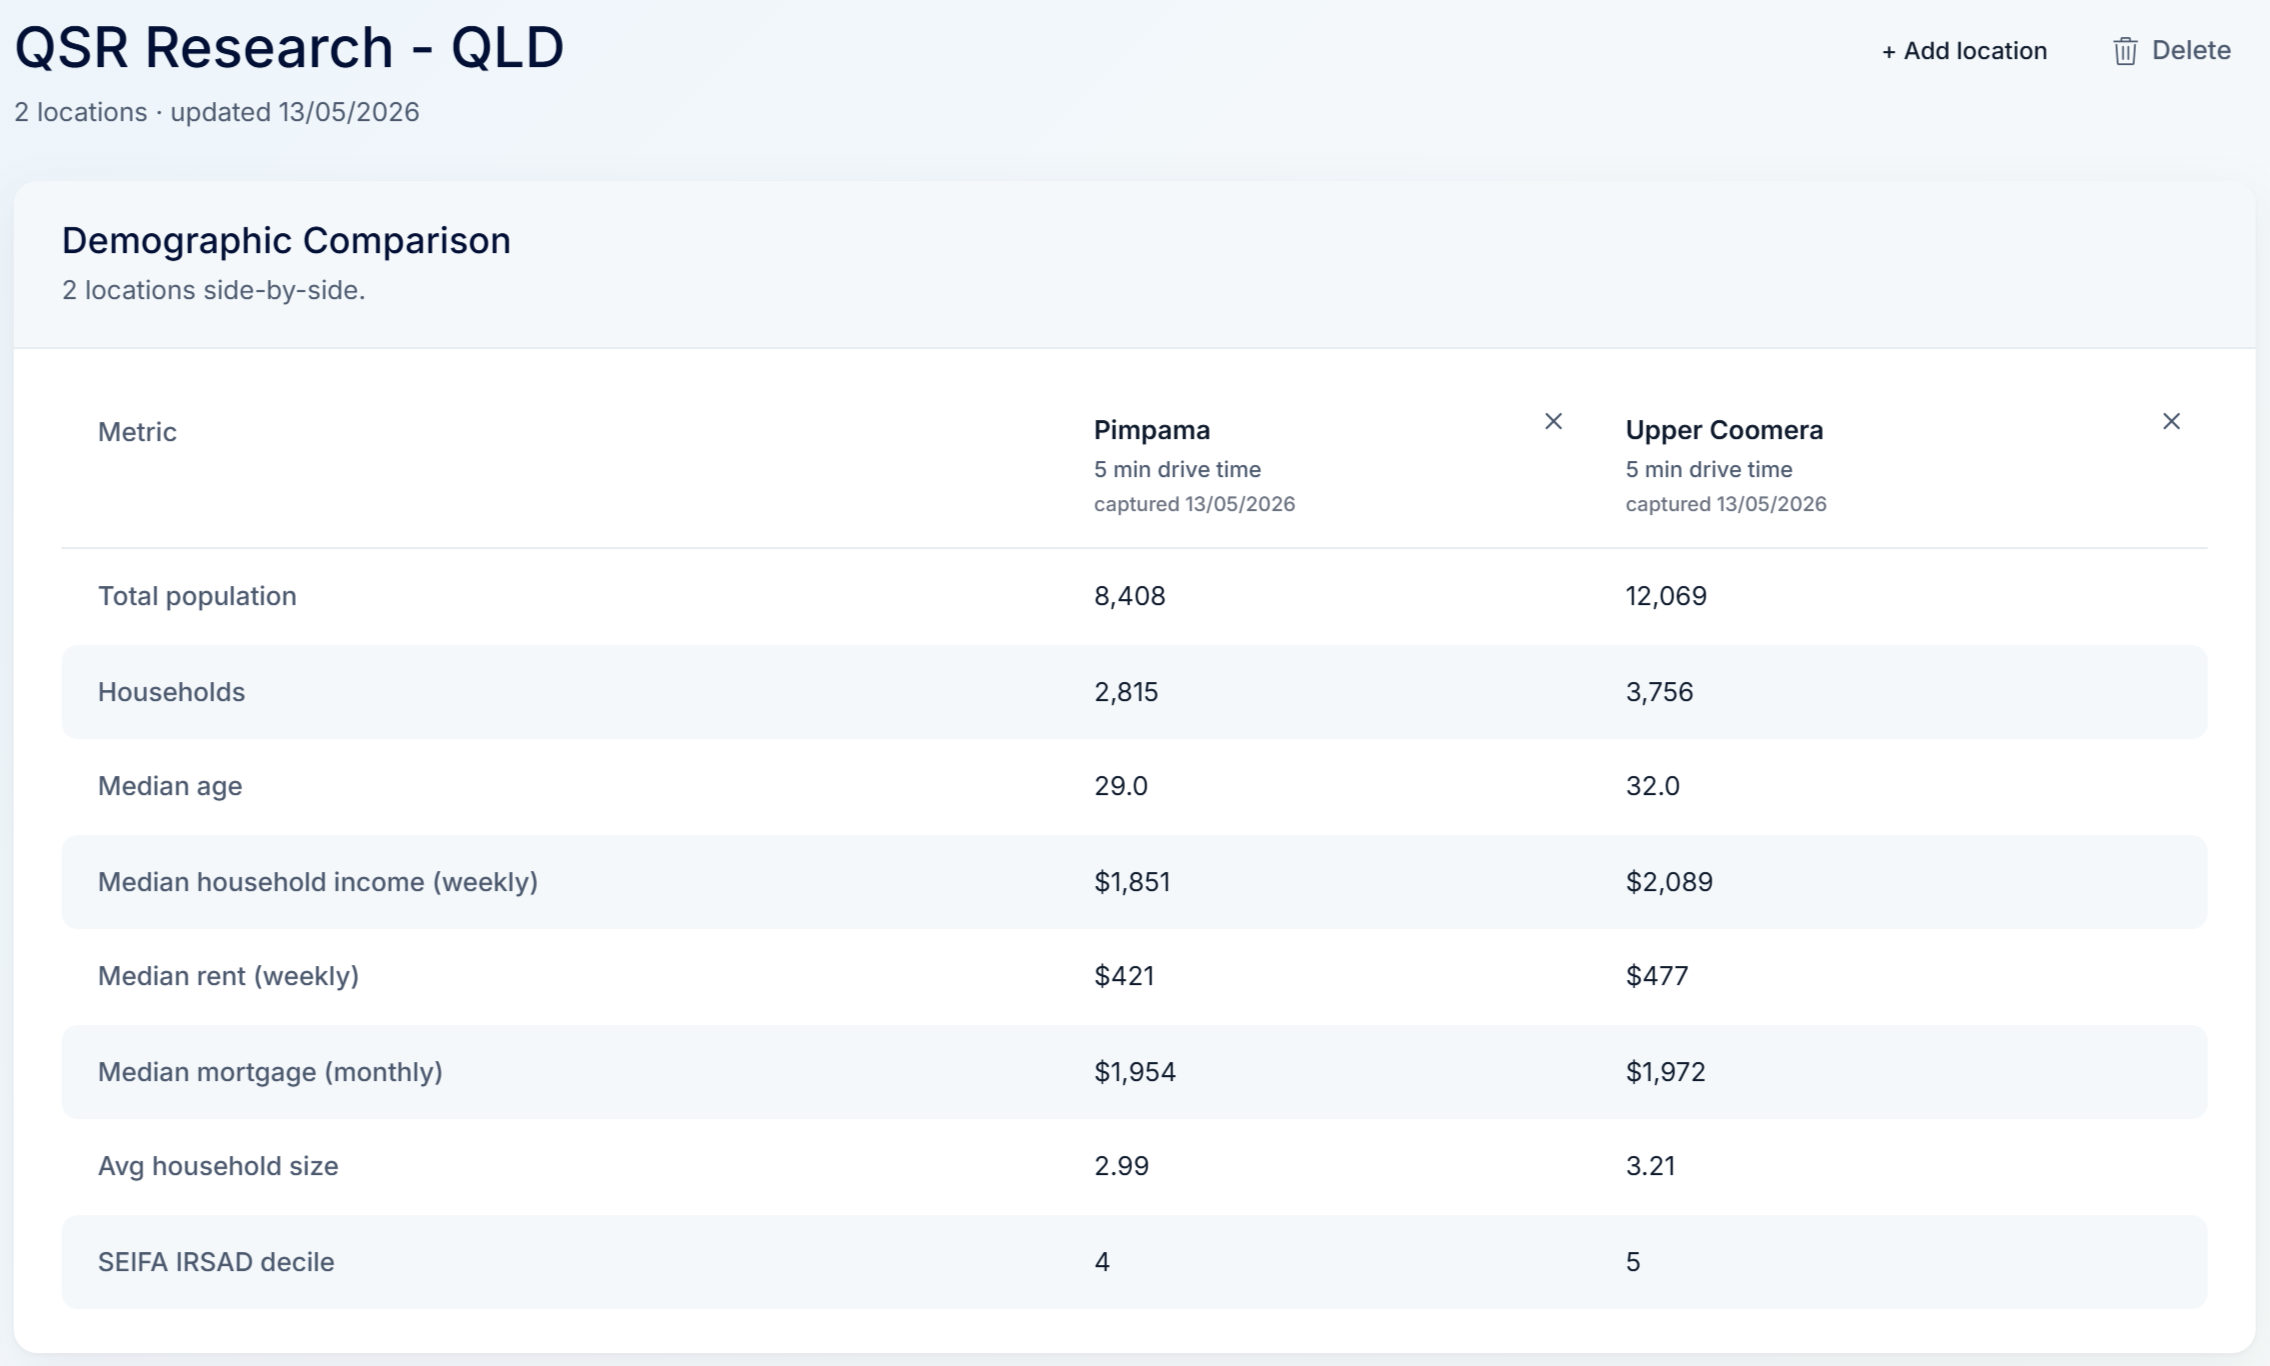

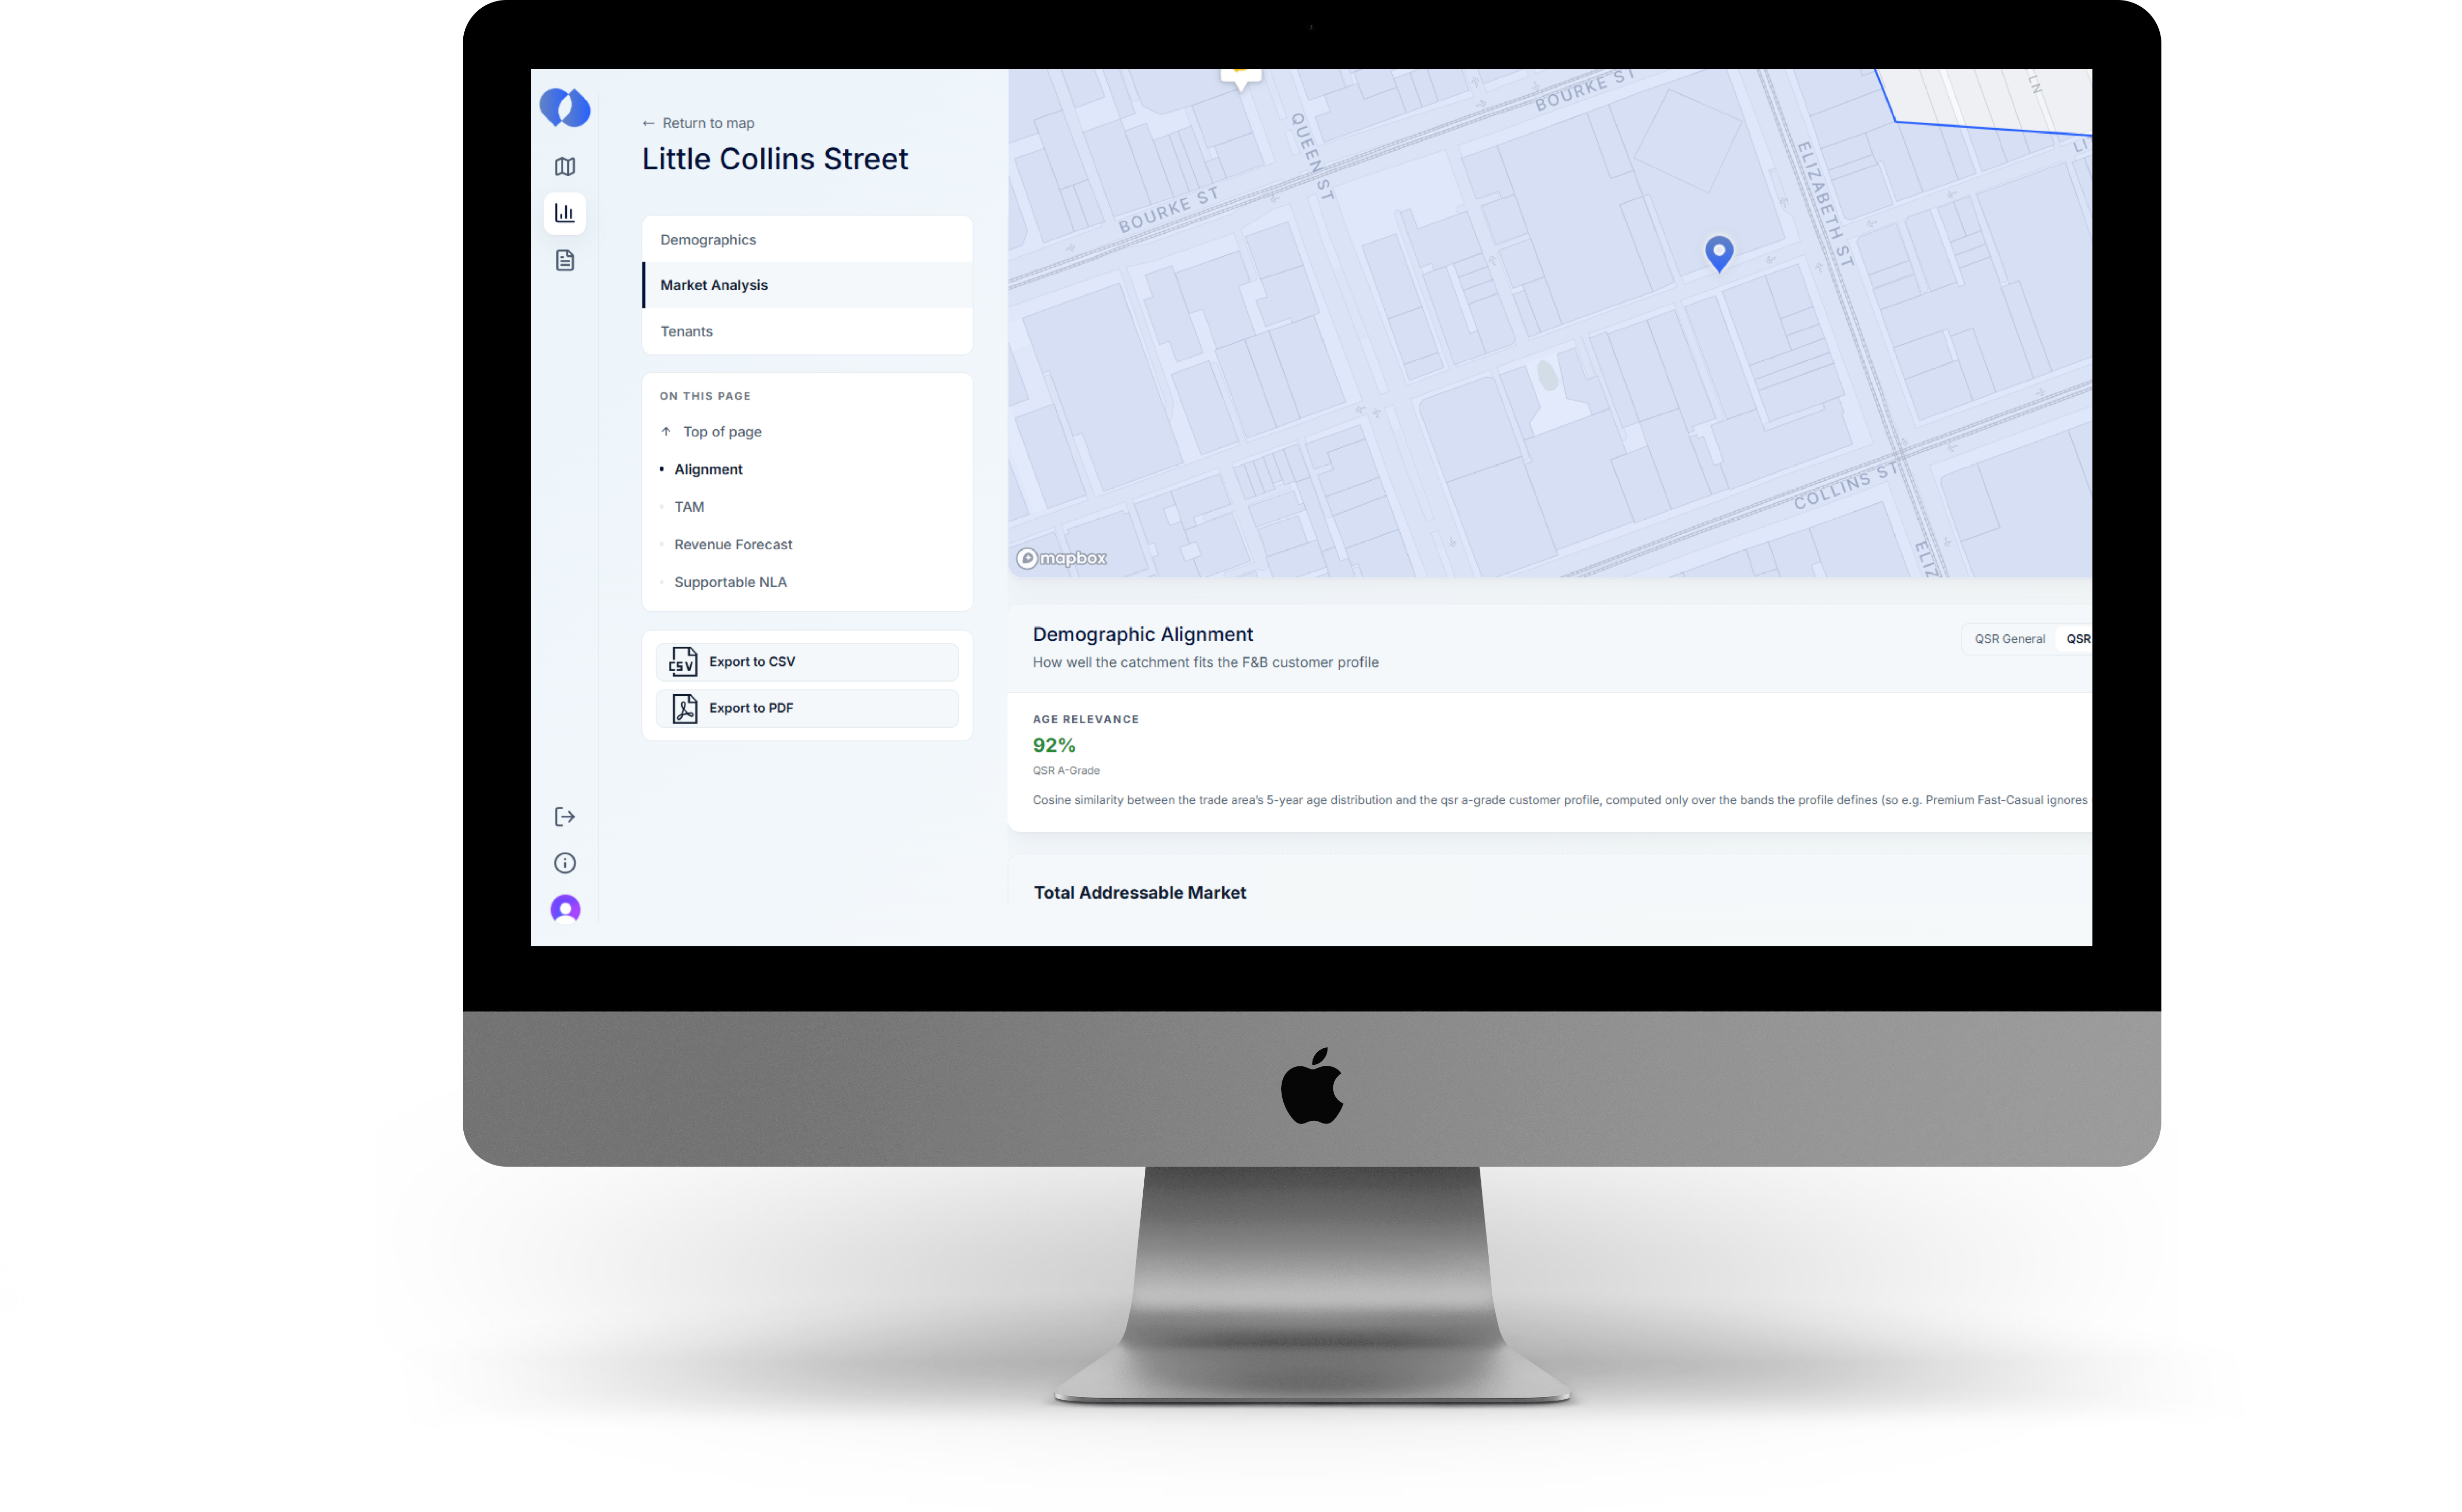
One report. Every section. Compared side-by-side.
The full demographic + market analysis renders as a single read-mode report, text or chart per table. Save snapshots of any catchment to a comparison report and stack 2+ locations against each other.
- Save catchment snapshots to comparison reports
- Side-by-side matrix view across saved locations
See your next site, before you commit to it.
Built for site selection teams. Sign up and start evaluating sites the same day. No GIS engineer required.